Housing Attainability in Washington in 2025
Washington State’s Housing Attainability Index
Background
The Housing Attainability Index, formerly the Housing Affordability Index, is a recurring Washington-based resource for understanding the extent to which county-level housing markets are providing a range of choices that are affordable – and thus, attainable – to the state’s workforce.
Originally, the home building industry has relied upon the National Association of Home Builders “Priced-Out Report” to communicate the health of local housing markets. With construction costs escalating at record-high levels due to an aging workforce and supply chain shocks, the number of families priced-out with each $1,000 of added cost of building a new home is less important to the industry in a market that seems to be getting expensive at every level.
Executive Summary
Housing affordability continues to be front of mind, with 1 in 3 Washingtonians listing Housing Affordability as their top issue for the current 2025 Legislative Session, according to the latest Cascade PBS/Elway Poll. The legislature has passed a handful of bills in recent years that aim to make housing less expensive to build, and therefore less expensive to purchase (or rent). Even so, much work is to be done if the state is to achieve 1.1 million new units over the next 20 years.
The impact of unaffordable housing is felt most acutely by low- and middle-income households, who often struggle to afford basic necessities because housing costs consume more than 30% of their monthly income. While it’s paramount that our state provides housing units for all its residents, it’s also important for ensuring an equitable economic landscape; as those who are unable to afford housing in desirable areas may be forced to move to less desirable locations or commute longer distances to work.
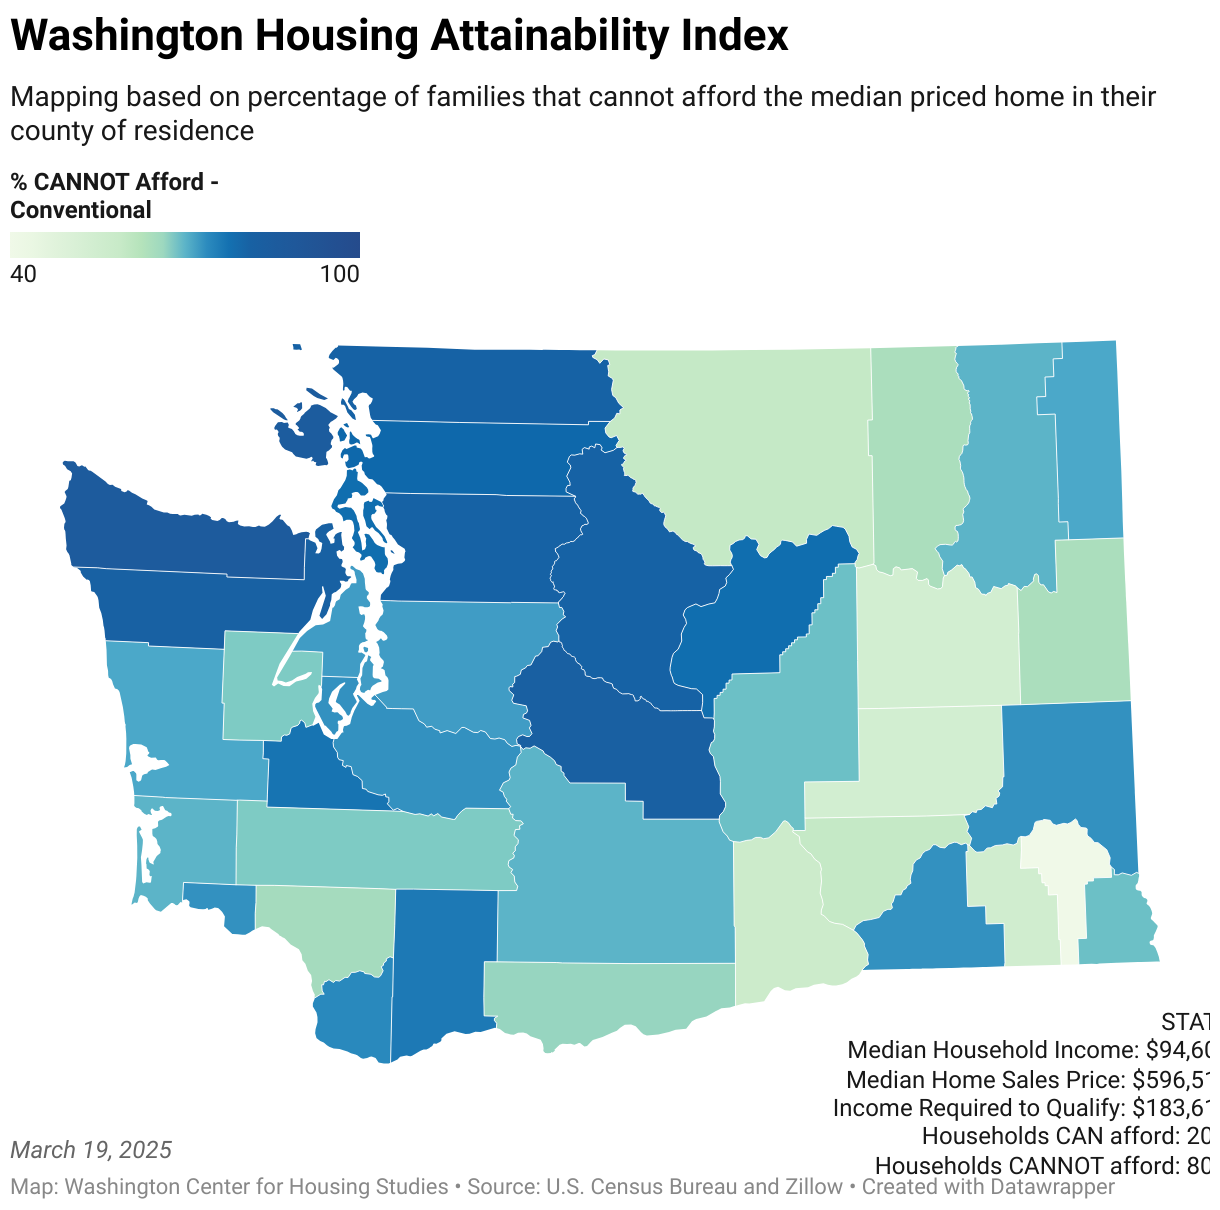
In this study, we find that home ownership is unaffordable for 80% of Washington families, as the average percentage of area median income required to qualify for a loan is 194% or $183,619. However, the average Washington state household only earns $94,605, approximately half the income required to qualify for a median priced home, priced on average across the state at $596,514.

Methodological Approach, Assumptions, and Limitations
The Housing Attainability Index now utilizes a modified mortgage affordability formula that incorporates Federal Housing Administration (FHA) guidelines and property insurance, which assumes that 28% of household income is allocated to mortgage payments and that the household has 3% of the home’s purchase price readily available for a down payment. It also does not account for monthly personal debt payments or homeowners’ association fees, all of which can vary significantly from household to household.
We gathered data from publicly available sources including the United States Census Bureau, the Bureau of Labor Statistics, and Zillow. After gathering data, we completed calculations for determining affordability based on the following data assumptions:
- The average credit score range for Washington consumers is 722 according to Equifax.
- Home sales price by county as reported by Zillow Market Report, the most recent data set available at time of data pull.
- In 2024, the average property tax levy rate reported by the Department of Revenue is $8.93 per $1,000 of assessed value. This average, calculated across all counties, is based on the median home value and the typical annual property tax payment. Consequently, homes assessed above the median home value will be less affordable for buyers.
- Interest rate was accessed on February 11 and may not be based upon today’s interest rates. For reference, the average interest rate reported was 6.7% based on a 722-credit score.
Our analysis shows that an income of $183,619 is needed to qualify for an FHA loan at the median home sales price in Washington State. According to Census Report Table B19080, the upper limit of the fourth income quintile for Washington Households is $184,724, with a margin of error of ±$1,961. Since our required income falls within this margin, we can reasonably conclude that around 80% of Washingtonians are unable to afford a home at the median price, as their incomes are below the threshold to qualify for an FHA loan.
For county income data, we utilized the American Community Survey (ACS) Table S1901, specifically the 2023 ACS 5-Year Estimates Subject Tables. Utilizing these assumptions, even though they’re not free from limitations, help us tailor affordability rates to each county’s economic reality, rather than holding all variables constant across the state. Accounting for county differences is crucial to providing the most realistic illustration of affordability for each county.
Results
In the Housing Attainability Index table in the preceding pages, you will find crucial information useful for understanding the health of the state’s housing market. For now, we will turn the discussion to key findings.
The area median income (AMI) required to qualify for a mortgage is well above the established 50% and 80% AMI limits for qualification for many of the available affordable housing programs. When we consider that oftentimes in order to purchase the median home in Washington State, at a cost of $596,514, you must, on average, earn 194% of AMI (or $94,605 per year) and have a hefty savings account to apply towards a down payment (to the tune of $20,877 for a 3.5% downpayment), the future of the American Dream of homeownership is grim.
Housing Attainability Index [March 2025]
The graph below illustrates the percentage of families that can and cannot afford the median priced home in each county. At the state level, only 20% of Washington families can afford the median priced home; this statistic includes existing homeowners as well, operating on the assumption that these homeowners may someday sell their home and need to purchase another home.

Policy Implications and Recommendations
While many of the variables that make up the housing market are largely out of control of the state and local governments, there are several variables we can control with logical public policy decisions that ensure homeownership opportunities can persist for generations to come.
Infrastructure funding
The Washington State Department of Commerce administers the Connecting Housing to Infrastructure Program (CHIP), established in 2021, and oversees the allocation of funds to public/nonprofit housing for utility connections and related improvements to support affordable housing development. While CHIP has proven to be useful, it is critical to expand its funding to allow jurisdictions to invest in targeted infrastructure projects, rather than offering funding on a project-by-project basis. This will lower development expenses, streamline project delivery, make housing more affordable, and benefit communities at large.
Workforce Housing
Often neglected in the discussion regarding the housing crisis, is the extent to which middle-income households have become priced out of the market. The table below shows common median income earners such as firefighters, teachers, and nurses, comparing their individual salaries to the Area Median Income (AMI) and also doubling their income to represent a dual-income household. This highlights how dual median-income households are often unable to afford a home and that single-income households are at an even larger disadvantage of ever becoming homeowners.

While focusing on housing affordability for households earning 80% of AMI and below is important, it is equally critical to address the needs of the median-income earners who are also facing financial strain. Few, if any, programs exist for households that earn between the AMI levels of 80% and 120%. Expanding downpayment assistance to those making higher thresholds of AMI will be crucial for keeping the American Dream of homeownership alive. Oftentimes housing policy has been targeted at homeless and low-wage earners in our state, however, without equal emphasis on middle-earner housing, the affordability crisis and wealth gap will only deepen.
Energy Code Revisions
The current energy code requirements go significantly beyond national standards, and include costly mandates such as solar panels, heat pumps, and Heat Recovery Ventilators (HRVs), which aim to push the market toward greater sustainability at the expense of consumers. The focus of energy codes should return to establishing clear and achievable minimum standards that focus on energy conservation without pushing expensive technologies that may not be practical or cost-effective for all.
One example of this is the appliance package in the energy code, which includes a ventless dryer. However, due to practicality concerns, this appliance package is rarely used in practice and many households find that ventless dryers do not meet their needs or preferences. Additionally, the State Building Code Council (SBCC) has yet to update the state’s energy code to bring it into compliance with state law, as changed by Initiative 2066. Without timely revisions, the state continues to ensure attainable housing is out of reach for Washingtonians.
Rather than mandating specific technologies or attempting to drive market changes, the focus should be on achieving energy efficiency goals through practical, adaptable solutions that homeowners and builders can more easily implement. Returning the energy code to reflect a balance between cost-effectiveness, sustainability, and practicality will ensure better outcomes for all stakeholders. Codes that add significant cost to Washington renters and homeowners but do not improve the safety or health of the occupants should return to being questioned as to their appropriateness in being placed in the code instead of in legislation. Senate Bill 5429 proposed an expansion of the SBCC, to enhance local representation and expertise. The bill aimed to rebalance representation, increasing the number of private sector members from 7 to 13 to better ensure that professionals with hands-on experience in various construction specialties were included. However, the bill did not pass, highlighting the legislature’s unwillingness to take practical, low-cost steps to address the urgent needs of homeowners and renters.
Sources
- Average levy rates by county interactive data graphic. (n.d.). Washington Department of Revenue. Retrieved February 11, 2025, from https://dor.wa.gov/about/statistics-reports/average-levy-rates-county-interactive-data-graphic
- Census Reporter. (n.d.). Table B19080: Household income in the past 12 months (in 2020 inflation-adjusted dollars). Retrieved March 18, 2025, from https://censusreporter.org/data/table/?table=B19080&geo_ids=040%7C01000US&primary_geo_id=01000US
- Cohen, J. (2025, January 9). Poll: WA voters want 2025 Legislature to focus on their pocketbooks. Cascade PBS. https://www.cascadepbs.org/politics/2025/01/poll-wa-voters-want-2025-legislature-focus-their-pocketbooks
- United States Census Bureau. (n.d.-a). household income. Census Bureau Tables. Retrieved February 11, 2025, from https://data.census.gov/table?q=household%20income
- United States Census Bureau. (n.d.-b). S1903: Census Bureau table. Retrieved February 11, 2025, from https://data.census.gov/table/ACSST1Y2022.S1903?q=S1903:%20Median%20Income%20in%20the%20Past%2012%20Months%20(in%202022%20Inflation-Adjusted%20Dollars)&g=040XX00US53
- United States housing market: 2025 home prices & trends. (n.d.). Zillow. Retrieved February 11, 2025, from https://www.zillow.com/home-values
- Washington - May 2023 OEWS state occupational employment and wage estimates. (n.d.). Bureau of Labor Statistics. Retrieved February 11, 2025, from https://www.bls.gov/oes/2023/may/oes_wa.htm
- What is an FHA loan? (n.d.). Zillow. Retrieved February 11, 2025, from https://www.zillow.com/mortgage-rates/fha-mortgage-rates/
Disclaimer
The content in this report is intended for informational purposes only. The information contained in this report may not constitute the most up-to-date economic, housing, or other information, nor does it represent a complete assessment of the housing market. This report does not constitute any recommendation or solicitation to any person to enter into any transaction or to adopt any investment strategy. Any business or investment decisions should not be based purely on the information presented in this report. Readers are encouraged to seek independent professional investment, legal, and/or tax advice. All liability with respect to actions taken or not taken based on the contents of this report are hereby expressly disclaimed. The content is provided "as is;" no representations are made that the content is error-free.