
Washington’s 2024 Residential Energy Code
Affordability Gains and Energy Choice Penalties

Executive Summary
The proposed 2024 WSEC-R is unusual because, for the average 2,376 sq ft home, it may lower construction costs compared to the 2021 WSEC. This analysis estimates average first cost savings of about $1,759 under the prescriptive pathway and about $4,307 under the Energy Rating Index compliance pathway. Most of those savings come from two changes: updated home size brackets and the new ERI pathway, which gives builders more flexibility than the prescriptive code.
However, the savings are not evenly distributed. Homes using electric heat pumps generally have lower compliance costs than homes using natural gas. Even with the 2024 WSEC’s overall cost reductions, gas homes face $25,319.85 more in construction costs to comply with the code compared to electric homes. This is because the WSEC continues to set different effective energy savings targets by heating fuel type and requires additional costs like electric readiness for gas homes.
This study also provides a Housing Attainability Rating, a simple score between +3 and -3 that rates how much a proposed change is likely to improve or worsen housing attainability in Washington. Several proposed changes will increase costs, limit design options, or not produce net cost savings for consumers in a reasonable timeframe. For those proposals, this report recommends lower cost alternatives for the SBCC to make targeted changes before final adoption to remove unnecessary cost increases or design limitations.
Overall, the 2024 WSEC includes important affordability improvements, but targeted amendments are still needed to reduce unnecessary costs.
Introduction
The Washington State Building Code Council (SBCC) is preparing to adopt the 2024 Washington State Energy Code for residential and commercial buildings (WSEC-R and WSEC-C respectively). A recent study from the National Association of Home Builders (NAHB) showed that—based on surveys from builders and developers—the cost of regulation for the price of an average new home is $131,734[1]. Out of that regulatory cost, 30% or $40,288 comes from changes to the building codes over 10 years. While that figure is for all building codes, builders often cite the energy code specifically as one of the biggest regulatory cost drivers for housing. In this study, we will analyze some of the most significant changes in the 2024 WSEC-R, estimate how they will likely change construction costs, and analyze their likely effect on housing affordability and attainability in Washington.
Building codes in Washington state are based on codes that are created by model code organizations, which are updated in 3-year cycles. The WSEC is an amended version of the International Energy Conservation Code (IECC) from the International Code Council). One notable difference is the WSEC is not adopted by reference, unlike the other building codes we adopt from the ICC. The entirety of the WSEC, including the full adoption and amendment of the IECC, appears in Chapter 51-11R of the Washington Administrative Code.[2]
Why does the energy code matter?
The purpose of building codes is to regulate minimum life and fire safety requirements for new and existing buildings. While calculating life and fire safety is possible, it can be more challenging in direct cost estimation (i.e. number of lives saved, the cost impact of human losses, or fire risk). Energy codes regulate minimum energy efficiency requirements for new and existing buildings. Energy efficiency, in contrast to life and fire safety, is a much more straightforward calculation. Generally, more efficient materials and systems cost more money upfront, but they help a building use less energy for heating, cooling, and lighting which generates savings through reduced energy bills. In theory, these long-term savings offset the higher upfront costs. However, recently the energy code has diverged from regulating only energy efficiency to also restricting the use of natural gas and pushing for electrification.
How we got an energy code
Pursuing energy efficiency regulation largely started in the U.S. in response to the energy crisis of the 1970s. Constrained energy supply due to geopolitical conflicts drove up consumer energy prices. There was a national interest in reducing our energy use both to save money and help strengthen our national security. Regulating energy efficiency was seen as a cost-effective way to indirectly reduce energy use (making appliances and buildings more efficient doesn’t necessarily stop people from using more energy).
The U.S. created minimum efficiency standards for appliances with the Energy Policy and Conservation Act (EPCA) of 1975 and in Washington state the first WSEC, regulating building energy efficiency was adopted in 1977[3]. Beginning in the 1990s and 2000s, energy policy started to focus more on addressing anthropogenic (human-caused) climate change. The goal moved beyond merely setting minimum energy efficiency standards to pursuing more aggressive targets and achieving decarbonization and electrification (i.e. having an energy system that doesn’t use fossil fuels like coal, oil, gasoline, and natural gas) in an effort to mitigate the negative effects from global warming caused by the greenhouse gas effect.
Energy codes became sought after as a policy vehicle to limit, and eventually eliminate, fossil fuel use in buildings and appliances. In 2009, the Washington State Legislature added two new requirements for the energy code. First, an aggressive requirement that all construction permitted under the 2031 WSEC “must achieve a 70% reduction in annual net energy consumption, using the adopted 2006 WSEC as a baseline.”[4] Second, to “help achieve the broader goal of building zero fossil-fuel greenhouse gas emission homes and buildings by the year 2031.”[5]
Subsequent energy code adoption cycles in Washington state became more contentious as there were continuous pushes to make the codes not only more stringent but one of—if not the most—stringent in the nation. Affected industries and some consumers pushed back concerned a large increase in stringency would increase construction costs and make housing less affordable. Stringency proponents argue that being the leader in energy efficiency requirements would produce cost savings for consumers. However, energy efficiency wasn’t the only target.
Discouraging natural gas in homes
The energy code has different compliance pathways, typically performance or prescriptive based. Performance-based compliance offers the most flexibility and should allow for more affordable compliance. However, in the WESC-R, requirements to determine performance-based compliance are complicated and require more design costs and energy modeling to be done. Prescriptive compliance is much more common because it is simpler, despite having less flexibility.
The prescriptive pathway in the energy code has base requirements that every home must achieve. Then to reach desired energy targets, each home must comply with a certain number of additional requirements through a credit-based system. For example, using a space heating appliance that is higher than federal minimum efficiency, a home would receive some extra credit.
The 2018 code added a new section (R406.2) called carbon equalization/fuel normalization that changed the number of additional credits a home must achieve adjusted based on the carbon emissions of the heating fuel type.[6] The effect of this section is that homes must achieve different energy conservation targets depending on what fuel type they use for heating. Homes using natural gas must achieve more energy savings (or a more stringent target), than homes using heat pumps (which for residential uses are largely electric only). Generally, equipment and assemblies that are more efficient are more expensive. So having to meet a more stringent target will cost more.
The original 2021 WSEC was more direct; it changed gas from getting zero carbon emission credits to negative three credits. During the adoption process for the 2021 WSEC, the U.S Court of Appeals for the Ninth Circuit ruled that a ban on new natural gas hookups by the City of Berkeley was preempted by EPCA.[7] This caused the SBCC to reopen rulemaking for the energy code out of concern the code as adopted would risk EPCA preemption. Gas was given zero credits instead of negative three and to compensate, all other types were given more credits and the overall credit requirements in R406.3 were increased.[RH1] The R406.2 section name was unchanged from carbon emission equalization, but the table name was changed from fuel normalization to energy equalization. The end effect was the same. If a building used natural gas, it would need to achieve more savings than the same home using an electric heat pump.
It’s easy to see how natural gas is penalized when you compare credit requirements for heating types across the last few WSEC editions. Each 0.5 credit in R406 is considered equivalent to 600 kWh of energy savings. The credits “provided” in R406.2 carbon count towards the required credits in R406.3. So, by subtracting the carbon emission equalization from the primary credit requirements and multiplying each half credit by 600 kWh we can average the effective energy savings required across home sizes for each heating type. This is illustrated in the graph below.

The graph shows that the 2015 WSEC did not treat fuel types differently. The 2018 WSEC introduced penalties for electric resistance and natural gas. Then the 2021 WSEC made these penalties far more severe, particularly for natural gas. On average, new homes using natural gas in Washington are expected to achieve 2,000 to 3,000 kWh more energy savings than homes using electric heat pumps.
While the R406.2 credits were originally intended to be based on carbon emissions, it’s unclear what it is now calculating and trying to achieve. The modeling criteria have never been made public, or if it once was, it is no longer available on the SBCC website. Carbon emissions are typically regulated by green codes, not energy codes. Also, the WSEC conveniently only looks at site energy (except for off-site renewables which get credit in the code). So, any attempt to calculate the carbon emissions of the heating types would ignore the fact that 26% of Washington’s electricity generation comes from natural gas. The section also implies it seeks to normalize fuels (fuel normalization table). Because heat pumps are more efficient than furnaces, as furnaces generate heat by burning fuel and heat pumps transfer thermal energy from outdoors to indoors (or the opposite for cooling), generally homes using heat pumps should use less total energy than home using furnaces. But that energy difference alone is unlikely to explain the large disparity between gas and electricity in R406.2. [RH2]
Under the current WSEC, a small home (less than 1,500 square feet) can get its five required credits just by using a zonal mini-split heat pump. Whereas the same small home using a high efficiency natural gas furnace (worth one credit) would need four more credits. Which could be achieved by increasing the thermal envelope performance, reducing the air leakage rate, and possibly adding solar. For Washingtonians who want new natural gas homes, this means paying more to comply with the energy code compared to a similar home using an electric heat pump. For Washingtonians purchasing homes relying on electric heat pumps this likely means they are getting a less efficient home and paying more for their energy bills (due to a less efficient building and electricity costs), potentially even in comparison to older homes.
This topic is especially important after the passage of Initiative 2066 in 2024 (Note: The Building Industry Association of Washington, sponsor [RH3] [PH4] of the Washington Center for Housing, also sponsored I-2066).[8] The initiative added new requirements to the adoption and amendment of the energy code that it may not discourage, penalize, or prohibit the use of natural gas in buildings (RCW 19.27A,020(3)). Proponents of the current energy code stringency argue that how the code treats heating types differently is not a discouragement or penalty for natural gas but instead rewarding electric heat pumps for their greater energy efficiency.
If rewarding energy efficiency is the goal, then heat pumps with natural gas backups should be the most energy efficient option, and thus the least penalized. They benefit from the high efficiency of the heat pump at optimal temperatures and then as it gets colder and the heat pump gets less efficient it switches to a natural gas furnace which does not lose efficiency in cold weather. Yet gas backup heating is discouraged when compared to other heat pump options which will be far less efficient for heating during cold periods. [RH5]
This graph understates the full extent that gas is punished because on top of getting more credits in R406.2, heat pump heating can get more credits in R406.3 additional credits options than natural gas options. While the credit differences in R406.3 may be reasonable due to actual energy efficiency differences (assuming they are modeled fairly), combining them with R406.2 increases the severity that heat pumps are rewarded with lower standards and gas use is penalized. If the code were only rewarding electric heat pumps, then all buildings would have the same effective energy savings target regardless of what heating type they use. That was the case in the 2015 WSEC, but since then the WSEC has been more stringent on natural gas use than electricity.
Resource Adequacy
The push for an all-electric grid means that existing homes and infrastructure that relies on natural gas will need to be converted at some point. As mentioned previously, 26% of Washington’s electricity generation comes from natural gas.[9] Additionally, one third of homes in Washington use natural gas for primary heating.[10] The residential sector accounts for one fourth of the state total for natural gas consumption.[11] The U.S. Census Bureau estimates the total number of housing units in Washington state at 3,436,929.[12] With these data points we can make a rough estimate for how electricity demand will increase if existing natural gas homes are converted to all-electric (assuming electric heat pump for space and water heating, and cooling).
3,436,929: total housing units in Washington.
1,134,187: ~33% of WA homes that use natural gas for primary heating.
9.1 mBtu: average space heating use by electric homes for the U.S. West.[13]
11.3 mBtu: average water heating use by electric homes for the U.S. West.[14]
7.0 mBtu: average air conditioning use by electric homes for the U.S. West.[15]
27.4 mBtu: combined average energy use for heating and cooling by electric homes.
31,076,712 mBtu: annual average energy use for WA natural gas homes if converted to electric.
9,107,651,991 kWh: same figure, converted to kWh.
9108 gWh: same figure, converted to gWh.
9.1 tWh: same figure, converted to tWh.[PH6] [PH7]
Let’s contextualize what 9.1 tWh of annual energy usage looks like. The Columbia Generating Station, the third largest power plant and largest nuclear power plant in Washington produces 7.7 tWh annually.[16] The Chief Joseph hydroelectric dam, the second largest power plant in Washington produces 11.2 tWh annually.[17] So, just to meet demand for converting current homes using natural gas to electric, Washington would need another nuclear or hydroelectric [PH8] power plant. The hypothetical power plant would need to produce enough power to become the new third largest power plant in the state. This estimate only accounts for homes relying on natural gas for primary heating (not secondary heating or other uses) and doesn’t account for future homes. Nor does this estimate account for the fact that homes which use natural gas for heating tend to rely on it most during the peak winter months, when the electricity generation from hydro and other renewables is low. So, the increase in demand for electrification could be greater than the conservative, but staggering, estimate of 9.1 tWh.
While the Washington State Legislature that is setting the all-electric policy direction for the state. The SBCC is not a utility or responsible for managing supply and demand. But it’s helpful to understand the real-world impact that residential electrification will have on the grid. Building new generation facilities is not easy. Nuclear power plants have a lengthy regulatory approval process and take considerable financing. Hydroelectric dams are great, but instead of building new ones there has been growing political pressure to close existing ones in Washington. So, the WSEC is pushing for homes to use electricity instead of natural gas meanwhile [RH9] electricity supply is becoming constrained, and it will take some time and incredible resources to build new generation.
How the SBCC amends the WSEC
As mentioned, there are primarily two statutory mandates for the WSEC. First, to achieve a 70% reduction in net energy consumption from the 2006 WSEC by 2031. Second, to incrementally move towards that target with each cycle update. The SBCC has technical advisory groups (TAG) for each code with members selected by the SBCC representing affected industries, building officials, fire services, local government, state government, and environmental groups.
The WSEC amendment process starts with staff and TAG reviewing the differences between the current WSEC and the new version of the IECC “model code”. They decide whether to maintain state amendments or include new provisions from the model code where there are differences. This part of the process is called the integrated draft. Then the SBCC opens a submittal window where code change proposals can be received from anyone in the public. The accepted proposals are then sent to the TAG for review.
Proposals sent to the TAG must be approved by a majority in order for the SBCC to consider them for adoption (RCW 19.27.033(3)).[18] The TAG can amend proposals before approving them to move forward. Any proposals denied or not approved, do not move forward in the process. The package of proposals approved by the TAG then go through the respective committee, in this case the Mechanical, Ventilation, Plumbing, and Energy Codes (MVPE) Committee, and then the SBCC. The committee and council can make further amendments without TAG review before sending all proposed changes forward in the rulemaking process (CR-102) and receive public comment on them.
Considering that the SBCC must make the WSEC incrementally more efficient each cycle on the way to a 70% reduction by 2031, and they incorporate changes from the IECC, it’s logical to assume that a technocratic and expert-drive process would start with modeling comparing the baseline (the 2006 WSEC) to the newest edition of the model code so we can see where it scores relative to the 70% reduction. Once that information is available, it should be relatively easy to identify the lowest cost ways to achieve the target energy efficiency increase for the cycle. This, however, is not how the SBCC currently operates.[RH10]
The process is more reliant on guesstimation. The TAG uses no energy modeling or cost estimation when evaluating the new model code and creating the integrated draft. When submitting proposals, proponents are supposed to provide some cost estimating and use a life cycle cost estimation Excel form, but many proposals do not include this. If they do provide some data, the quality and parameters of the cost estimating are inconsistent. Energy code proposals are also supposed to estimate energy savings, but that runs into the same issues as the cost estimation. In the defense of proponents, someone may be an expert providing a helpful code change suggestion but lack the training and expertise to do quality cost estimation or energy modeling.
The SBCC does obtain “independent” preliminary cost-benefit analysis (CBA) on the proposed changes, which this study will analyze, for the public comment period. While technically independent, the SBCC gets to heavily influence what the final report looks like and says. Additionally, the preliminary CBA often still relies on the cost estimation provided by code change proponents. Furthermore, the SBCC often struggles to adopt the code in their required timeframe and so having the preliminary CBA show that the code is not cost-effective would require them to restart the process. This structurally motivates the SBCC to have the preliminary CBA confirm the worthiness of their proposed changes instead of having it be an objective filter for proposed changes that are not cost-effective.
After final adoption, often significant changes are made based on public comment, and the SBCC has a final cost-benefit analysis made. The final CBA usually includes some type of energy modeling that the SBCC can use to inform the legislature of their progress towards the 2031 target. Similar to the preliminary CBA, because of the timing of this analysis, the SBCC is motivated to have the modeling confirm that the adopted changes are cost-effective instead of being an objective filter.
For the 2018 WSEC, the SBCC contracted with Ecotope to model a baseline on the 2006 WSEC.[19] To determine compliance with the 70% reduction mandate, the SBCC looks at the total building stock and weights it across the two Washington state climate zones to model the energy use or savings for a cycle. This makes it so that every building type doesn’t necessarily need to achieve 70% savings. Instead, some building types can achieve less while others achieve more as long as the weighted stock reaches the target. This doesn’t come up as much in the residential code but is important for how additional credit requirements are decided in the commercial code (which affects multifamily construction).
Example of building stock weighting for the WSEC

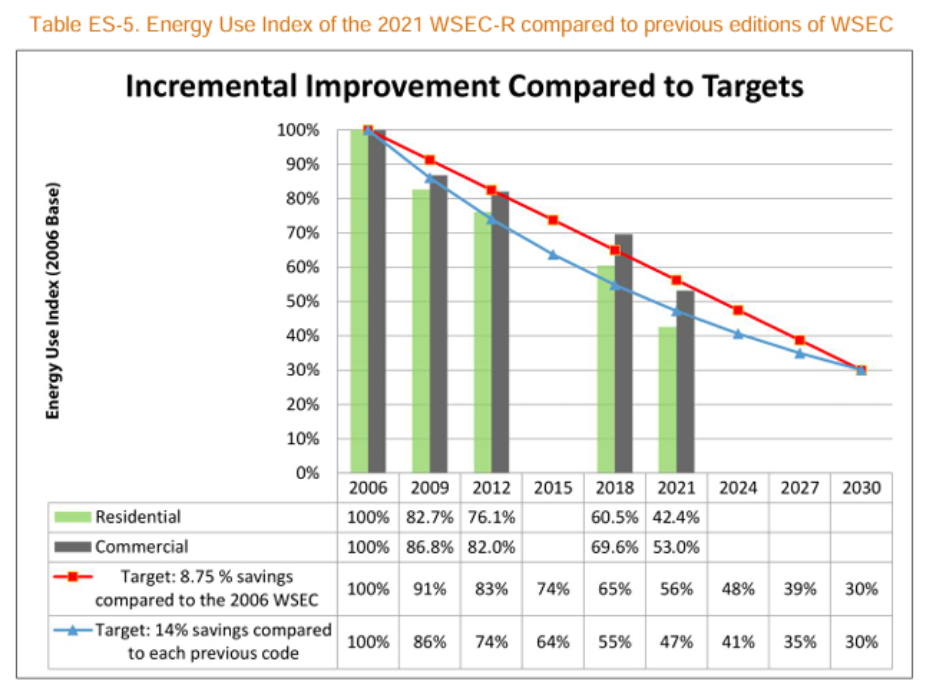
For the 2021 WSEC the SBCC contracted with the Pacific Northwest National Laboratory (PNNL). They did not model the 2006 WSEC baseline directly, but gauged compliance towards the 70% reduction from the 2018 WSEC. Below is a graph that is often used by the SBCC to show glidepaths to the 2031 target. The red line is a consistent 8.75% savings every cycle relative to the 2006 WSEC. The blue line is a 14% savings compared to the prior code cycle, which requires larger jumps in stringency for most of the cycles. But as we get closer to the 2031 target, each cycle improvement becomes smaller. The SBCC generally targets the blue line. The 2018 WSEC fell between the red and blue lines (there is no modeling available on the 2015 WSEC). Then the 2021 WSEC saw a massive savings increase that overshot the blue line target. This helps explain why there was such strong pushback to the 2021 WSEC and why it has been seen as so costly in the industry.
WSEC progress to 2031 70% reduction
Estimating the 2024 WSEC-R effect on housing affordability
The SBCC has released a preliminary CBA[22] for the proposed 2024 WSEC-R.[23] The analysis for more minor changes was performed by SBCC staff and is largely reliant on code change proponents cost and energy usage estimates. For larger changes they contracted with Morant McLeod to perform analysis, mostly checking proponents’ work. This study will look at a selection of significant proposed changes and do a housing affordability analysis, estimating their effect on construction costs. Additionally, this report will rate the proposals on a scale of how they improve or worsen housing attainability.
Housing Affordability Analysis Methodology
Following assumptions and baselines used, unless otherwise noted.
Reference home: U.S. Department of Energy (DOE) residential single-family prototype assumptions.[24]
- Conditioned floor area: 2,376 ft2.
- Footprint and height: 39.8-ft-by-29.8 ft, two-story, 8.5-ft-high ceilings.
- Window area: Fifteen percent equally distributed to the four cardinal directions (or as required to evaluate glazing-specific code changes).
Baseline: Minimum code requirements for the 2021 WSEC.
Scope: Estimate the first cost (i.e. change in initial construction costs in contrast to operational, maintenance, and replacement costs), analyze qualitative changes in construction methods, and calculate amount of annual energy cost savings required for simple payback period of 15 years (most homeowners and renters stay in one home for less than 15 years, typical mortgages are 30 years, proposed changes should provide beneficial savings to consumers for at last half of the average mortgage period).
Housing Attainability Rating
Simple score between +3 and -3 that rates how a proposed change affects housing attainability in Washington. A positive score indicates that a proposal is likely to improve housing attainability. A negative score indicates that a proposal is likely to make housing attainability worse.
+1 for each item:
- Lowers construction costs
- Lowers consumer energy bills with a simple payback period under 15 years
- Increases design options
-1 for each item:
- Increases construction costs
- Simple payback longer than 15 years
- Decreases design options
Total Estimate
The following tables show the estimated change in construction cost for the 2024 WSEC compared to the 2021 WSEC. Most of our estimates for individual changes did not fully calculate labor costs, so we factored a rough labor estimate into the total. Overhead and profit represents additional cost to the builder or general contractor by subcontractors.
2024 WSEC-R Compliance Cost Change (Prescriptive Pathway)
%20.jpg)
2024 WSEC-R Compliance Cost Change (ERI Pathway)
.jpg)
For a 2,376 sq ft home, we estimate that the 2024 WSEC-R, on average, will save between $1,758.63 to $4,306.86 in construction costs. In a state where the energy code typically increases construction costs every cycle, this is a remarkable achievement. Most of these savings come from the new home size brackets for Table R406.3(1) and the new ERI compliance pathway (R408). The ERI pathway shows the greatest potential for savings by offering performance-based compliance.
2024 WSEC Additional Compliance Costs for Gas Homes

Despite saving construction costs between code cycles, the 2024 WESC continues to discourage natural gas use in homes. We estimate that the average home will face $25,319.85 more in construction costs to comply with the code compared to a similar sized home using an electric heat pump.
Estimate Overview

Median Housing Attainability Rating: -1.5
Window Requirements | Table R402.1.2 | 24-RE-036
Brief description:
The energy code has base requirements for how much thermal energy can escape through windows, walls, and other components.
The vertical fenestration U-factor (widow energy efficiency) in the 2021 WSEC is 0.30, the 2024 WSEC is lowering this to 0.27. The 2024 IECC requires 0.28 for WA climate zones.
How construction changes:
There are multiple technical pathways to achieve a targeted U-Factor. Based on ENERGY STAR Version 7.0 Criteria Analysis Report, going from 0.30 to 0.27 the most common pathway likely requires improved frames and spacers. This may mean better training for crews on the ground installing the window assemblies.
Most medium and large sized homes achieve much lower U-Factors in order to get credits in the additional credit requirements of R406.3. So, this change will likely only impact small homes (under 1500 SF), which need less additional credits.
SBCC CBA:
It incorrectly cites 0.28 as the baseline (which was in the integrated draft). For this rulemaking, the baseline is the current 2021 WSEC, which is 0.30.
Says they use the ENERGY STAR Version 7.0 Criteria Analysis Report, however the numbers they cite are not directly found in the report.
Proponent analysis:
- First cost: $285/home
- Energy savings: $7.70/year
Morant McLeod analysis:
- First cost: $0.12/sf
- Net LCC: -$0.11/sf
- Payback: 44 years
Housing Affordability Analysis:
- Baseline: 0.30 U-Factor, 15ft2 = avg window
- Improved spacers: $4-6.50/window (use midpoint $5.25)[25]
- Foamed frame: $8-12/window (use midpoint $10)[26]
- 0.27 window cost increase: ~$5/window[27]
- Sum cost increase: $20.25/window
Total first cost: $481.14
Energy cost savings needed for 15-year simple payback: $32.08/year
Housing Attainability Rating: -2
- Increases construction costs
- Simple payback longer than 15 years
Lower Cost Alternative:
- Amend proposed change to use a U-Factor of 0.28.
- The ENERGY STAR analysis places 0.28 and 0.30 in the same bucket for construction methods. NAHB estimated that going from 0.30 to 0.28 to be half the cost of going from 0.30 to 027.[28] Using 0.28 would also align with the 2024 IECC code, which is preferred by builders.
- This will primarily affect small homes which will likely help improve housing affordability. Almost all medium and large homes will need to use much lower U-Factors to meet their additional credit requirements.
Cap on Windows | R402.1.5 | MVPE Change
Brief description:
- Makes the component performance alternative equation more restrictive, by restricting the maximum amount of glazing (windows) in the reference design to 15% of total conditioned floor area.
- Was originally intended to be included in the 2021 WSEC but was accidentally left out and was not eligible to be included in the 2023 EPCA changes.
- The equation is being updated to match the 2024 IECC with the 15% cap added in.
How construction changes:
- Most builders use this equation through the WSU C3 Calculator to achieve additional credits for the thermal envelope exceeding the base code requirements by 15-30% (Table R406.3 Option 1.2-1.4).
- Adding this cap will make it extremely difficult to go 15-30% above code without limiting window area to 15%.
- This will mean smaller windows or fewer windows for medium and large size homes.
SBCC CBA:
- The SBCC analysis incorrectly states this is a current code requirement. It was intended to be in the 2021 WSEC but did not make into the final adopted code.
Housing Affordability Analysis:
- Qualitative: Reducing the size or number of windows limits natural lighting, which provides health benefits for occupants (although the energy code is not a life safety or wellness code).
- Won’t necessarily change construction costs, but limits design options for consumers.
- Housing Attainability Rating: -1
- Decreases design options
Lower Cost Alternative:
- Do not adopt the cap. Follow the current 2021 WSEC and 2024 IECC way of using the same area as the proposed building for reference building.
- Homes will still achieve energy savings by reaching more stringent U-Factors and F-Factors for window and wall assemblies.
Air Leakage Rate | R402.5.1.3.1| 24-RE-037
Brief description:
- Reduces the maximum allowable air leakage rate to 3.0 air changes per hour (ACH) for homes greater than 800 sq ft.
- Air leakage rate of 4.0 ACH remains for homes smaller than 800 sq ft.
How construction changes:
- The IECC has required 3.0 ACH since the 2018 code for Washington’s climate zones.[29] Most medium and large homes under the current code are likely targeting lower air leakage rates to qualify for additional credit options.
- This will likely only affect small homes, the way air leakage rates are calculated, it is harder for smaller homes to achieve lower rates.[30]
- If a home doesn’t initially achieve the score there will be extra material costs for additional sealant and labor costs to reduce potential leakage areas, retest and repeat until the target result is achieved.
SBCC CBA:
- First cost: $308.40/home | $0.0307/sq ft
- Annual energy cost savings: $0.0211/sq ft
Housing Affordability Analysis:
- The material and labor cost increase should be minimal for medium to large homes, most are likely already achieving lower ACH.
- The requirement is too burdensome for small homes, who may not be able to achieve the 3.0 ACH air leakage rate. The IECC has alternative calculation options and targets for homes 1500 sq ft and under.
- Housing Attainability Rating: -1
- Increases construction costs
Lower Cost Alternative:
- Retain maximum 3.0 ACH limit for most homes generally. Amend to use IECC language to exempt multifamily units and homes 1500 sq ft or less if they can achieve certain air leakage rate using a different calculation method. 2024 IECC uses 0.27 cubic feet per minute (cfm) per sq ft, 2024 WSEC requires 0.25 cfm per sq ft for multifamily.
- The 2024 IECC also allows more flexibility for homes building to performance pathways, allowing up to 4.0 ACH. This could be adopted as well to allow more trade-off options for performance-based code compliance.
Roof Solar Reflectance | R402.7 | 24-RE-010
Brief description:
- Homes with low sloped or flat roofs must use materials that meet certain solar reflectance and thermal emittance requirements.
- In climates with a lot of sunlight, using materials with high solar reflectance can reduce the cooling load on the building. The proponent submitted the proposal to mitigate the heat island effect.[31]
How construction changes:
- To use low sloped or flat roofs, homes will need to use specific products for the roof that meet minimum ratings for solar reflectance or thermal emittance.
- This can entail specialty membranes, liquid-applied roof coatings, or other materials.
- This will likely most affect multifamily buildings, three stories or less, that sometimes use flat roofs to maximize the building area while meeting local height requirements.
- Flat or low sloped roofs have become a more popular design option for modern housing styles.
SBCC CBA:
- First cost: $0.23/sq ft of roof area
- Negligible energy savings
Housing Affordability Analysis:
- Washington has minimal cooling loads. The 2024 IECC has a similar code section that is an option for additional credits in climate zones 0-2 (R408.2.1.3).[32] This proposed change is unlikely to achieve meaningful energy savings in Washington.
- NAHB estimated the 2024 IECC option will cost an extra $0.32/sq ft of roof area for specialty shingles (assuming a minimum of 1188 sq ft roof area for DOE model w/low slope or flat roof).
- Total first cost: $380.16
- Energy cost savings needed for 15-year simple payback: $25.34/year
- Housing Attainability Rating: -3
- Increases construction costs
- Simple payback longer than 15 years
- Decreases design options
Lower Cost Alternative:
- If WA was in a climate with more sunlight, then this proposal may be worthwhile if converted to an additional credit option like in the IECC.
- Without energy savings, this proposal does not fit in the energy code and should not be adopted statewide.
H/ERV for CZ 5 | R403.6.1 | 24-RE-038
Brief description:
- This new section requires heat or energy recovery ventilators (H/ERV) in climate zone 5 (eastern Washington). H/ERVs transfer heat from outgoing air to incoming fresh air, reducing the heating load on space heating equipment. The converse is true for ERVs, they can transfer heat and moisture from incoming fresh air to outgoing conditioned air, reducing the cooling load on air conditioning equipment.
How construction changes:
- Mechanical ventilation is already necessary because the International Residential Code requires it for homes with a maximum air leakage rate under 5 ACH. This can be achieved by whole house ventilation systems or for small homes and apartments with a continuous bathroom exhaust fan.
- Homes in Eastern Washington would have to install a HRV or ERV. This may require additional ducting or installation of an air handler.
- The WSEC pushes the adoption of electric zonal ductless (mini-split) heat pumps. Installing H/ERVs into homes relying mostly on mini-split heat pumps would likely require extra ducting and mechanical work.
SBCC CBA:
- First cost: $725/home
- Energy cost savings: $16.76/year
- PV of 50-savings: $669.29/home
- Net LCC: -$888 (including net fan and replacement costs)
- Simple payback (excluding replacement costs): 43.3 years
- Argues that the proposal should still be adopted for IAQ, health/safety, and resilience.
Housing Affordability Analysis:
- Baseline, continuous bathroom exhaust fan: $68[33]
- Technically, this could be subtracted from the HRV cost to show the difference in cost between the baseline. But a bathroom will need an exhaust fan anyways and this is a fairly affordable price.
- HRV, 68% SRE: $959[34]
- 20% for extra ducting/materials for installation: $191.8
- Total first cost: $1,150.80
- Energy cost savings needed for 15-year simple payback: $76.72/year
- Housing Attainability Rating: -3
- Increases construction costs
- Simple payback longer than 15 years
- Decreases design choices
Lower Cost Alternative:
- The SBCCs own analysis shows HRVs are not consistently cost effective enough to be a baseline code requirement. Small homes and apartments can pay for less for mechanical ventilation with a continuous bathroom exhaust. Some homes may see more cost-effective savings depending on their size, heating/cooling load, and HVAC/homecting system.
- This requirement could be converted to a dedicated additional credit option in R406.3, which would make it available as a reward when it makes sense and remove the unnecessary added costs on homes where it does not.
Electric Readiness | R404.5 | 24-RE-018
Brief description:
- All household appliances that use gas or liquid fuel must install electrical infrastructure for the appliances to be replaced in the future with electric appliances.
- This section is based on the 2024 IECC Appendix RK, except for space heating which is unique to the WSEC.
How construction changes:
- Gas cooking appliances, clothes dryers, and water heaters must have a 240V 30A (40A for cooking) dedicated branch circuit that terminates within three feet of the appliance. Space heaters must have a two-pole breaker space reserved for a future electric heat pump.
SBCC CBA:
- First cost: $0.23-$0.46/sq ft ($500-$1,010/home at 2,200 sq ft)
- Using DOE model: $617.76-$1,092.96/home
- Energy savings pre-replacement: $0/year
- Energy savings post-replacement: 50-66%
- Cost ratio (retrofit vs new construction): 2.5-4.0x more expensive as retrofit
- Net LCC (avoided cost minus upfront): +$0.33 to $0.57/sq ft (positive = cost effective)
- Using DOE model: =$784.08 to $1,354.32/home
Housing Affordability Analysis:
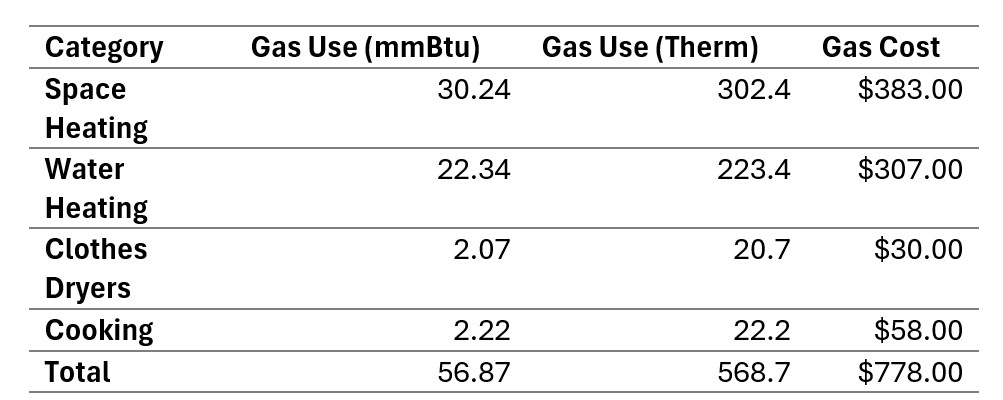
Average Gas Use & Cost (U.S., Marine)
Average Electric Use & Cost (U.S., Marine)

- The source data has energy usage broken down by home size, but that includes all climates. This study uses the average energy use for the marine climate, even though it includes all home sizes. We assume the average energy use for a marine climate including all homes sizes will produce a more accurate estimate for energy usage for the average home in Washington compared to the average energy use for the right home size bracket but including all climates.
- Energy savings: 60%
- All electric homes are estimated to have 60% lower energy use on a 1:1 basis than gas homes
- Energy cost savings: -3%
- All electric homes are estimated to have 3% higher energy costs than gas homes
- NAHB estimates for IECC electrification readiness (based on DOE model):[37]
- Electric ready cooking: $377/home
- Electric ready for dryer: $314/home
- Electric ready for water heater: $255/home
- (Breaker space for space heater is assumed to be a negligible cost)
- Total first cost: $946
- Assumed retro cost at 4x: $3,784/home
- Assumed energy savings (after electrification): -$21.00/year
- Assumed retro cost at 4x: $3,784/home
- Energy cost savings needed for 15-year simple payback: $63.07/year
- Cost effective: No
- The initial first cost of electric ready provisions is cheaper than retrofits. But avoided retrofits are a false dilemma. State policy is forcing utilities to decarbonize and mandates the SBCC develop energy codes that incrementally move towards zero new fossil fuel buildings and homes. Remove these mandates and consumers won’t be forced to retrofit.
- When you compare all electric homes to gas homes, electric homes use less energy on a 1:1 basis. However, because of the differences in fuel types and costs, homes tend to see higher bills for all electric appliances compared to gas appliances. Without producing positive energy savings, neither option pays for itself. Using gas or electric ultimately comes down to consumer preference.
- The initial first cost of electric ready provisions is cheaper than retrofits. But avoided retrofits are a false dilemma. State policy is forcing utilities to decarbonize and mandates the SBCC develop energy codes that incrementally move towards zero new fossil fuel buildings and homes. Remove these mandates and consumers won’t be forced to retrofit.
- Housing Attainability Rating: -3
- Increases construction cost
- Simple payback greater than 15 years
- Decreases design choices
- While electric readiness makes it easier for homeowners to retrofit later on, it adds unnecessary costs for consumers that know upfront they want to use gas appliances for the lifecycle of the building.
Lower Cost Alternative:
- Do not adopt, consumers can choose if they want to include electric readiness when starting out with gas appliances.
Home Size Brackets | Table R406.3(1) | 24-RE-035
Brief description:
- The WSEC has traditionally had three home size categories for determining how many additional credits a home must qualify for in R406.3: small, medium, and large.
- R-2 multifamily, and small additions are their own categories.
- This proposed change expands the categories into 250 to 500 sq ft brackets that go up in 0.5 to 1 credit increments. There are different options for final adoption contingent on other provisions being adopted (U-Factor 0.27, 3.0 ACH, and H/ERV requirements). This study assumes option 3 is the one most likely to be adopted. Option 3 creates separate credit targets for western (CZ 4) and eastern Washington (CZ 5).
- The credits were rebalanced so medium to small homes have lower credit requirements compared to the 2021 WSEC and medium to large homes have increased credits. The goal was to achieve a ~10% increase in overall efficiency across the building stock.
- For context: the IECC requires a fixed number of credits for all homes and then homes larger than 5,000 sq ft must additionally achieve a fixed number of extra credits.
- This helps solve a problem under the current WSEC where a home just below 1500 sq ft would only need 5 credits but a similar home at 1600 sq ft would need a total of 8 credits.
406 Credit New Requirement Changes (Option 3)
%20.jpg)
How construction changes:
- Because R406.3 has multiple options there are many different possible pathways to comply.
- Options have different costs. Builders will tend to pick the lowest cost options first. So, as credit requirements increase or decrease the incremental cost or savings will change erratically.
- Because homes effectively have different energy targets based on which fuel type they use for heating, homes using gas will see larger absolute changes in cost differences but homes using electric heat pumps will have a greater change based on percentage.
SBCC CBA:
- The SBCC analysis assumes an average cost of $1,000/home/credit. This is flawed because credit options vary wildly in costs, and it’s also likely a low estimate for an average. So, the SBCC is likely underestimating both the cost increases and cost reductions from this change.
- First cost: $1,000/home/credit ($500/0.5 credit)
- Net LCC: +$4,577/home/credit
- Payback: 7.2 years
Housing Affordability Analysis:
- The SBCC analysis is underestimating both the cost increases and cost decreases of this change because using an average cost per credit is extremely flawed. This is due to the differences in costs between credit options. This study will not use average cost per credit for our analysis but to show how off the SBCC analysis is, we found an average cost of $3,614.75/credit.
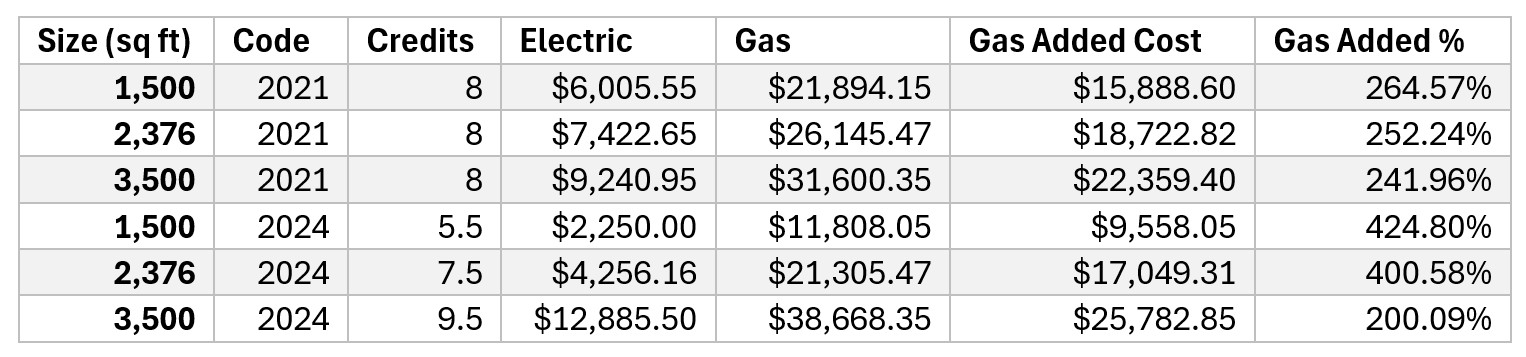
- For this analysis we estimated costs for a majority of R406.3 credit options (Appendix 1) and selected likely pathways for three homes sizes based on our primary DOE model and the top and low-end extremes for credit changes. We also modeled code pathways for electric vs gas use. These costs represent the incremental costs for each credit option above code minimum requirements or federal minimum efficiency equipment (i.e. higher efficiency gas furnace compared to minimum gas furnace).
Home Size Brackets Cost Change 2021 vs 2024

Home Size Brackets Cost Change Electric vs Gas
- This analysis assumes that solar panel systems call be installed in custom sizes smaller than the typical 5/6 kW sizes.
- The proposal is quite successful in lowering costs compared to the 2021 WSEC for smaller homes with cost decreases between ~45% to 62.5%. On the other hand, medium-to-large homes could see cost increases between ~22% and ~40%.
- The proposal has created a greater disparity in compliance cost differences (as a percentage) between gas and electricity for small homes. This is because R406.2 basically gives heat pumps free credits, so homes using gas have effectively a higher credit requirement to achieve. Also, credit costs don’t change linearly. For example, the 2,376 sq ft home with a 0.5 credit reduction will see similar cost reductions to an electric 1,500 sq ft home with a 2.5 credit reduction.
- So, under the 2024 WSEC complying with R406.3 will cost a 1,500 sq ft home using gas ~4.2 times more than a similar sized home using electric heat pumps. Whereas under the 2021 WSEC it would only cost ~2.6 times more.
- For homes 3,500 sq ft and larger the relative difference between gas and electric compliance costs will decrease, but the absolute compliance costs will increase ~15%.
- First cost: -$10,086.10 to $7,068.00
- Energy cost savings needed for 15-year simple payback: $0 to $471/year
- Housing Attainability Rating: +2
- Two out of the three models decreased construction costs
- Two of the three models see increased design options
- Medium-to-large homes are unlikely to see cost savings sufficient to have a 15-year simple payback
Ducting Limitation | Table R406.3(2) | 24-RE-034
Brief description:
- This proposal focuses on requiring ductwork to be located in conditioned space or deeply buried in insulation.
- However, a TAG amendment changed R406.3 option 4.1 so that it could not be used with a provision which allowed some ductwork for forced air ducts to be outside of conditioned space as long as they are insulated to certain amount.
How construction changes:
- Forced air ducts need some minimal amount of ductwork to be outside of conditioned space (like attics) so the supply and return ducts can reach outdoors.
- Option 4.1 is one that most gas homes rely on to comply with R406.3 and not having it would likely need to be replaced with solar panel credits, which are more costly.
SBCC CBA:
- First cost: $0.073/sq ft (weighted)
- Using DOE model: $173.45/home
- Annual energy savings: $0.0546/sq ft
- Using DOE model: $129.73/home
- Net LCC: +$1.62/sq ft
- Payback: 10.3 years
Housing Affordability Analysis:
- Source: NAHB 2024 IECC Analysis (Table 8, R408.2.4(2)) (avg between slab and basement)
- First cost: $1,481.50/home ($0.62/sq ft)
- Energy cost savings needed for 15-year simple payback: $98.76/year
- Housing Attainability Rating: +1
- Increases construction costs
- Lowers consumers energy bills, with a simple payback under 15 years
- Decreases design options (R406.3 option 4.1 change)
- Increases construction costs
Lower Cost Alternative:
- The change to option 4.1 in R406.3 should not be adopted so that credit option remains viable for forced air heating systems. Otherwise, this proposal is cost effective and will produce savings for consumers over the lifetime of a mortgage.
ERI Pathway | R408 | 24-RE-033/040
Brief description:
- This proposed change adopts and amends the Energy Rating Index (ERI) compliance pathway from the model code. BIAW was the proponent of proposal 040 and worked with NEEA, the proponent of proposal 033 to combine the two proposals.
- This is an optional compliance pathway; it is a type of performance code where homes as designed and built are compared to a similar home if it was built to the 2006 IECC. Homes are tested by an energy rater and given a score between 0 and 100, where 100 represents being built to the 2006 IECC. The lower the score the closer the home is to using net zero energy.
- It offers some of the flexibility of a performance pathway, while providing an easy-to-understand score for builders, code enforcement, and consumers that roughly gauges the energy efficiency of the home.
- Unique to Washington, the targets have been set based on modelling from PNNL to match prescriptive requirements and have bracket sizes similar to the updated R406.3. Also, the amount of energy produced from on-site solar panels is limited to match the amount allowed in R406.3.
How construction changes:
- The ERI pathway allows for the thermal envelope to be 10% less stringent than the base code.
- It also allows for many variables like solar gain and building orientation which do not have equivalent options in the prescriptive pathway.
SBCC CBA:
- First cost: $0
Housing Affordability Analysis:
- Energy rater cost: $600-$860 (assume average $730)
- Estimate homes using ERI pathway save 2% of total construction cost ($7,687.31).
- We estimated that achieving a 15% increase in the thermal envelope for option 1.2 in R406.3 would cost 1% of total construction cost ($161.77/sq ft for total construction cost).
- Assume the 10% flexibility on the thermal envelope will save 0.5% of total construction costs.
- Assume additional 1% savings on total construction costs for options that are not available in prescriptive code.
- Assume an additional 0.5% savings for flexibility from performance-based compliance.
- First cost: -$6,957.31
- Energy cost savings needed for 15-year simple payback: $0
- Housing Attainability Rating: +3
- Decreases construction costs
- Simple payback period less than 15 years
- Increases design options
Replace AC with Heat Pump | R503.1.2.5 | 24-RE-019
Brief description:
- Upon replacement of a ducted air conditioner (AC), homes must either replace it with a heat pump that serves as the primary heating or do extra air sealing measures and testing for the replacement AC.
How construction changes:
- Option 1: replace AC with a heat pump
- Option 2: replace AC with AC and perform a mini blower door test to test the air leakage rate and perform additional air sealing to close gaps
- Extra labor costs and minimal material costs
SBCC CBA:
- First cost: $2,259/home
- Annual energy cost savings: -$66 to -$77/home (increases energy costs)
Housing Affordability Analysis:
- Incremental cost increase for option 1: $3,550
- Does not include if ducting system needs to be changed to fit different system.
- Average AC installation cost: $6750[38]
- Average heat pump installation cost: $10,000
- AC/heat pump installation cost difference: $3,250
- Remove gas furnace: $300
- Incremental cost increase for option 2: $500
- Mostly labor for testing and minimal material costs to close air gaps
- First cost: $500 (AC) / $3,550 (HP)
- Energy cost savings needed for 15-year simple payback: $33.33/year (AC) / $236.67/year (HP)
- Housing Attainability Rating: -3
- Increases construction costs
- Increases consumer energy bills
- Decreases design choices
Lower Cost Alternative:
- Do not adopt. This is an unnecessary amendment that tries to discourage gas use, increases construction costs, and doesn’t produce cost savings for consumers.
Appendix 1 – Table R406.3(2) Credit Options Cost Estimate
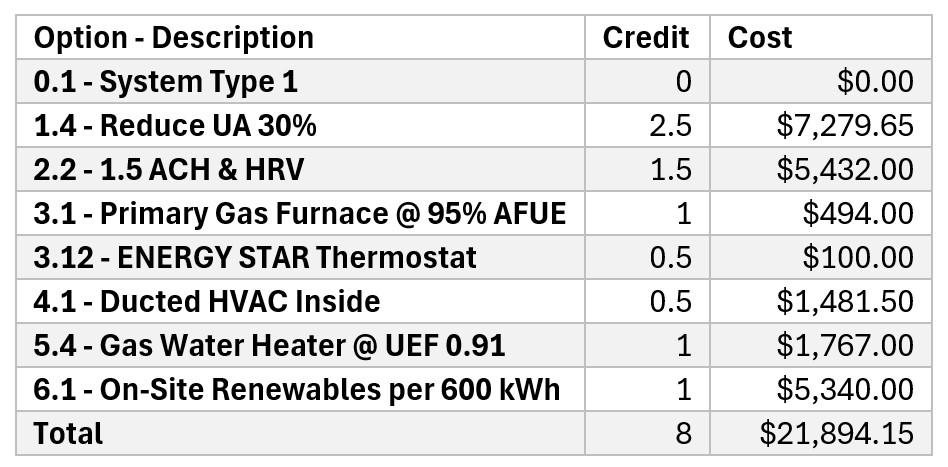
Appendix 2 – Table R406.3(2) Credit Pathways
2021 WSEC - 1500 sq ft - Gas
2021 WSEC - 1500 sq ft - Electric

2024 WSEC - 1500 sq ft - Gas

2024 WSEC - 1500 sq ft – Electric

2021 WSEC - 2,376 sq ft - Gas

2021 WSEC - 2,376 sq ft - Electric
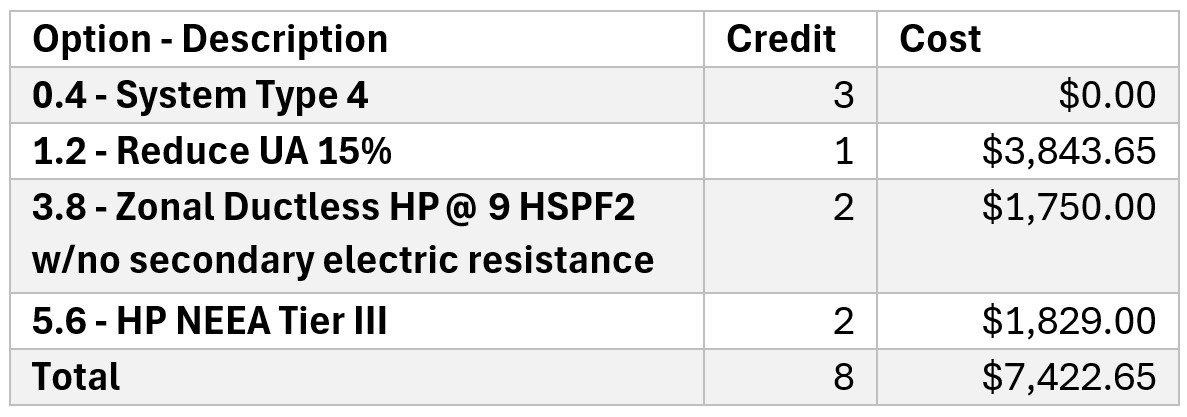
2024 WSEC - 2,376 sq ft – Gas

2024 WSEC - 2,376 sq ft - Electric

2021 WSEC - 3,500 sq ft – Gas

2021 WSEC - 3,500 sq ft – Electric
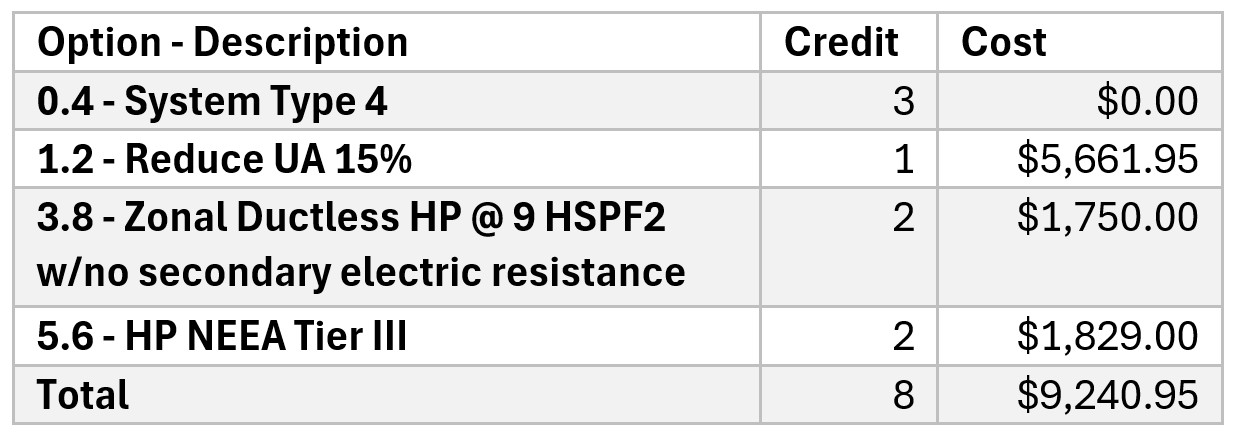
2024 WSEC - 3,500 sq ft – Gas
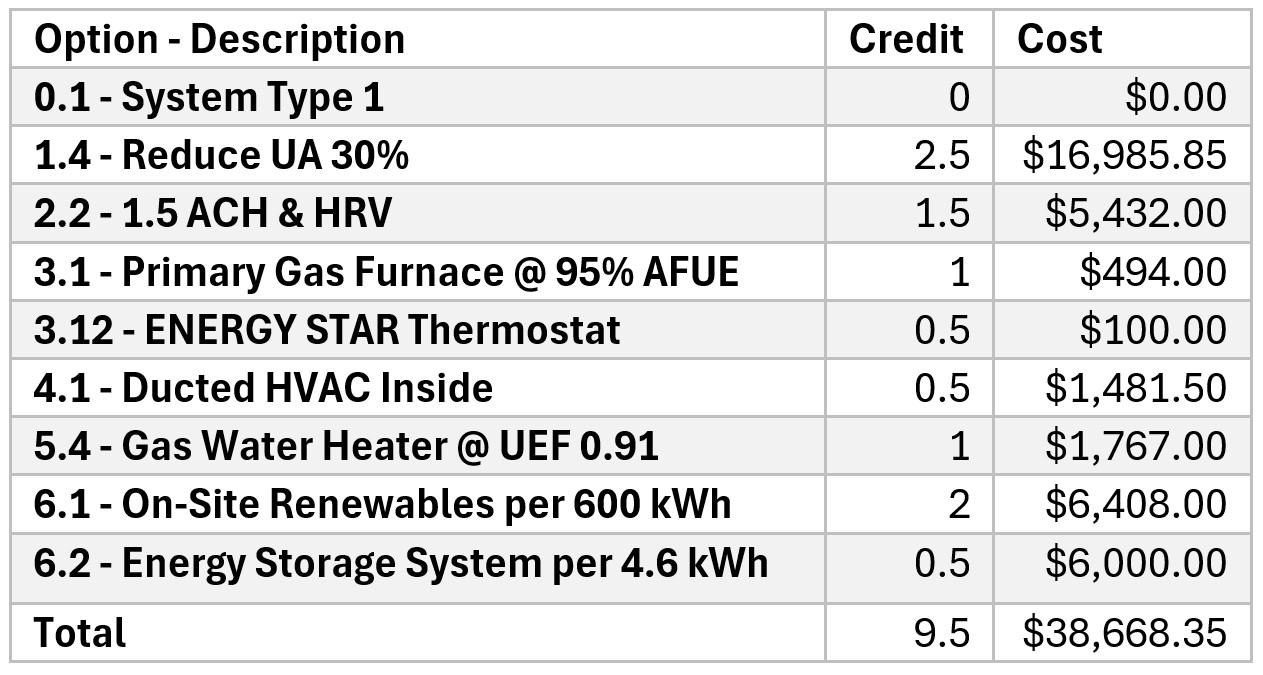
2024 WSEC - 3,500 sq ft – Electric


Sources
- National Association of Home Builders. (2026, June). Government regulation in the price of a home. https://www.nahb.org/-/media/NAHB/news-and-economics/docs/housing-economics-plus/special-studies/2026/special-study-government-regulation-in-the-price-of-a-home-june-2026-updated.pdf
- Washington State Legislature. (n.d.). Chapter 51-11R WAC: Washington State Energy Code—Residential provisions. Washington Administrative Code. https://apps.leg.wa.gov/wac/default.aspx?cite=51-11R
- Washington State Building Code Council. (n.d.). A timeline of statewide codes adopted in Washington. https://sbcc.wa.gov/about-sbcc/history/timeline-statewide-codes-adopted-washington
- State of Washington. (2009). Engrossed Second Substitute Senate Bill 5854: Chapter423, Laws of 2009. Washington State Legislature. https://lawfilesext.leg.wa.gov/biennium/2009-10/Pdf/Bills/Session%20Laws/Senate/5854-S2.SL.pdf?cite=2009%20c%20423%20s%205
- State of Washington. (2009). Engrossed Second Substitute Senate Bill 5854: Chapter423, Laws of 2009. Washington State Legislature. https://lawfilesext.leg.wa.gov/biennium/2009-10/Pdf/Bills/Session%20Laws/Senate/5854-S2.SL.pdf?cite=2009%20c%20423%20s%205
- Washington State Building Code Council. (2021). 2018 Washington State Energy Code—Residential: Final package. https://sbcc.wa.gov/sites/default/files/2021-02/2018%20WSEC_R%20Final%20package2a.pdf
- Sabin Center for Climate Change Law. (2023, April 18). Ninth Circuit holds Berkeley’s gas ban preempted by U.S. Energy Policy & Conservation Act. Columbia Law School. https://blogs.law.columbia.edu/climatechange/2023/04/18/ninth-circuit-holds-berkeleys-gas-ban-preempted-by-u-s-energy-policy-conservation-act/
- Ballotpedia.(2024). Washington Initiative 2066, Natural Gas Policies Measure (2024).https://ballotpedia.org/Washington_Initiative_2066,_Natural_Gas_Policies_Measure_(2024)
- U.S. Energy Information Administration. (n.d.). Washington state energy profile.https://www.eia.gov/states/WA/analysis
- Ibid.
- Ibid.
- U.S. Census Bureau. (2026). Annual estimates of housing units for the United States, regions, divisions, states, and counties: April 1, 2020 to July 1, 2025[Excel file]. https://www2.census.gov/programs-surveys/popest/tables/2020-2025/housing/totals/CO-EST2025-HU-53.xlsx
- U.S. Energy Information Administration. (2024). Table CE3.5: Annual household site end-use consumption in the U.S.—totals and averages, 2020 [PDF]. https://www.eia.gov/consumption/residential/data/2020/c&e/pdf/ce3.5.pdf
- Ibid.
- Ibid.
- Grid Info.(n.d.). Columbia Generating Station. https://www.gridinfo.com/plant/columbia-generating-station/371
- Grid Info.(n.d.). Chief Joseph. https://www.gridinfo.com/plant/chief-joseph/3921
- State of Washington. (n.d.). Chapter 19.27 RCW: State Building Code. Washington State Legislature. https://app.leg.wa.gov/rcw/default.aspx?cite=19.27&full=true
- Ecotope.(2020). Modeling the Washington State Energy Code: 2006 & 2018 baseline energy consumption [Report]. Washington State Building Code Council. https://sbcc.wa.gov/sites/default/files/2020-11/SBCC%20BaselineStudy%20Revised_inclusive%20Final_2020_Nov6.pdf
- Ibid.
- Pacific Northwest National Laboratory. (2023). Final cost-benefit analysis of the2021 WSEC residential provisions. Washington State Building Code Council. https://sbcc.wa.gov/sites/default/files/2023-02/Cost-Effectiveness%20of%202021%20WSEC-R.pdf
- Washington State Building Code Council. (2026). 2024 Washington State Energy Code residential preliminary cost-benefit analysis. https://sbcc.wa.gov/sites/default/files/2026-06/ResNRG_pCBA_full_v2_062426.pdf
- Washington State Building Code Council. (2026). 2024 Washington State Energy Code—Residential filed CR-102. https://sbcc.wa.gov/sites/default/files/2026-07/2024WSEC_R_FiledCR102_070126.pdf
- Pacific Northwest National Laboratory. (n.d.). Building energy codes program methodology. U.S. Department of Energy. https://www.energycodes.gov/methodology
- U.S. Environmental Protection Agency. (2023). ENERGY STAR residential windows, doors, and skylights version 7.0 specification: Draft 1 criteria analysisreport (Table 8, p. 16). ENERGY STAR. https://www.energystar.gov/sites/default/files/asset/document/ES_Residential_WDS_Draft%201_Criteria%20Analysis%20Report.pdf
- Ibid.
- Ibid, Figure 10. Rough estimate based on the green line, difference between 0.30 and0.27.
- Home Innovation Research Labs. (2024). Cost analysis of the 2024 International Energy Conservation Code changes (p. 14). National Association of Home Builders. https://www.nahb.org/-/media/NAHB/advocacy/docs/top-priorities/codes/code-adoption/2024-iecc-cost-analysis-hirl.pdf?rev=1c0950edb89e4e6195e99facb0a376f9&hash=2AB3239971E23F1EC5813048B05B188C
- International Code Council. (2018). 2018 International Energy Conservation Code: Residential energy efficiency, Section R402.4.1.2. ICC Digital Codes. https://codes.iccsafe.org/content/IECC2018P5/chapter-4-re-residential-energy-efficiency#IECC2018P5_RE_Ch04_SecR402.4.1.2
- Strand ,A. (2024, October 8). Blower door testing a small home. Building Performance Association. https://building-performance.org/bpa-journal/blower-door-testing-a-small-home/
- U.S. Environmental Protection Agency. (n.d.). Using cool roofs to reduce heat islands. https://www.epa.gov/heatislands/using-cool-roofs-reduce-heat-islands
- International Code Council. (2024). 2024 International Energy Conservation Code: Residential energy efficiency, Section R408.2.1.3. ICC Digital Codes. https://codes.iccsafe.org/content/IECC2024V1.2/chapter-re-4-residential-energy-efficiency#IECC2024V1.2_RE_Ch04_SecR408.2.1.3
- The Home Depot. (n.d.). VIVOHOME 160 CFM constant airflow smart 3-speed bathroom exhaust fan with humidity sensor. https://www.homedepot.com/p/VIVOHOME-160-CFM-Constant-Airflow-Smart-3-Speed-Bathroom-Exhaust-Fan-with-Humidity-Sensor-VH1797/337650390
- HVACQuick.(n.d.). Broan AI series heat recovery ventilators HRV with side ports. https://www.hvacquick.com/products/residential/HRVs-and-ERVs/Residential-HRV-ERV/Broan-AI-Series-Heat-Recovery-Ventilators-HRV-With-Side-Ports.
- U.S. Energy Information Administration. (2024). 2020 Residential Energy Consumption Survey: Consumption and expenditures data tables (Tables CE5.4and CE5.8). https://www.eia.gov/consumption/residential/data/2020/index.php?view=consumption#by%20End%20uses%20by%20fuel
- U.S. Energy Information Administration. (2024). 2020 Residential Energy Consumption Survey: Consumption and expenditures data tables (TablesCE5.3a/b and CE5.7a/b). https://www.eia.gov/consumption/residential/data/2020/index.php?view=consumption#by%20End%20uses%20by%20fuel
- Home Innovation Research Labs. (2024). Cost analysis of the 2024 International Energy Conservation Code changes (p. 13). National Association of Home Builders. https://www.nahb.org/-/media/NAHB/advocacy/docs/top-priorities/codes/code-adoption/2024-iecc-cost-analysis-hirl.pdf?rev=1c0950edb89e4e6195e99facb0a376f9&hash=2AB3239971E23F1EC5813048B05B188C
- PickHVAC. (n.d.). Heat pump vs. air conditioner cost: Installation & energy bills. https://www.pickhvac.com/heat-pump-air-conditioner-cost-installation-energy-bills/
Disclaimer
The content in this report is intended for informational purposes only. The information contained in this report may not constitute the most up-to-date economic, housing, or other information, nor does it represent a complete assessment of the housing market. This report does not constitute any recommendation or solicitation to any person to enter into any transaction or to adopt any investment strategy. Any business or investment decisions should not be based purely on the information presented in this report. Readers are encouraged to seek independent professional investment, legal, and/or tax advice. All liability with respect to actions taken or not taken based on the contents of this report are hereby expressly disclaimed. The content is provided "as is;" no representations are made that the content is error-free.