More Homes, Higher Prices
How Land Limits Contribute to Washington’s Housing Crisis
Builders responded to Washington’s population boom—but land scarcity still fuels the housing crisis.
Background
Washington state faces a severe housing affordability crisis. The Department of Commerce has called for more than 1.1 million more homes to be built in the next 20 years. Currently, approximately 80% of Washington households cannot afford to purchase the median-priced family home.
In 1990, the median home value in Washington was $93,200, which was roughly 278% of the median household income of $33,417 (Census Bureau-b); Office of Financial Management-b). Today, the median home value has skyrocketed to $611,301–nearly 646% of the median household income of $94,605 (Zillow; Census Bureau-a). This represents a 132% increase in the home price-to-income ratio since 1990, rising from approximately 2.78 to 6.46.
There are several explanations for the housing affordability crisis. One of the most pervasive is the often well intentioned “builders can’t or don’t build as much as they used to,” or “we just need more homes.” However, upon closer examination, these explanations oversimplify or mislead the complex reality of the housing market.
In fact, since 1990, total housing units in Washington have grown by 67%, outpacing the 65% population growth during the same period (Office of Financial Management-a). Similarly, the homebuilding industry has remained steady, accounting for 5–7% of private-sector employment over that time (Employment Security Department).
In simpler terms: The homebuilding industry has largely responded to Washington’s 35 years of exceptional population growth since its adoption of the Growth Management Act (GMA) in 1990.
But why, then, has housing become so much less affordable if there are more housing units per capita than 35 years ago?
Some natural demand-side explanations do exist despite units per capita increasing. These include a declining mean household size and a buyer preference for larger homes which has increased per capita housing consumption since 1990. This results in more units and more space needed to house each person. While those are meaningful factors, the decline in affordability can primarily be placed on cost components. Rising input costs for items such as labor, materials, energy standards, and regulatory compliance, have significantly pushed construction expenses higher. Put simply, it’s not a lack of production that has driven up housing prices.
Most fundamental of these input costs is the cost and availability of land, which today represents approximately 40% of construction costs and home values. Land is a fixed factor of production – more of it cannot be made. As population and urban economies grow, the value of developable land tends to increase because competition intensifies for this limited resource. This dynamic is further shaped by Washington’s land use policies.
In 1990, the state legislature adopted the Growth Management Act (GMA) to address concerns that uncoordinated growth could threaten the environment, economic sustainability, and quality of life. The GMA introduced Urban Growth Areas (UGAs) that regulate where urban development can occur, thus limiting sprawl. These boundaries deliberately restrict the spatial supply of land available for housing development.
Executive Summary
This report identifies land scarcity, particularly land available for urban development, as a key structural constraint responsible for some of the nation’s highest home prices.
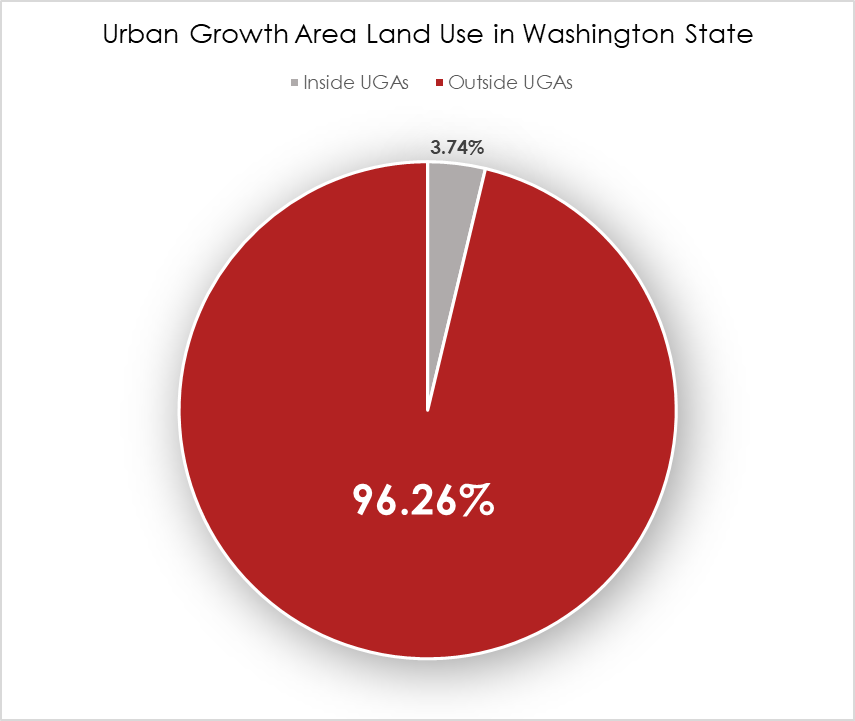
Through geographic information system (GIS) analysis, this report finds that only 3.74% of Washington’s total land area falls within Urban Growth Areas, where urban level development is allowed under the state’s Growth Management Act. Outside of the UGA, residential subdivisions, commercial centers, and industrial facilities that require urban services are generally prohibited. Instead, development in rural areas are limited to uses such as low-density housing, small-scale businesses, agriculture, etc. This spatial limitation on developable land exerts upward pressure on land prices, leading to scarcity within UGA boundaries, and significantly affecting overall housing affordability.
The GMA outlines a range of well-intended and ambitious goals, such as housing affordability at all economic levels, property rights, community engagement, and environmental protections. However, in practice, the attempt to balance 15 distinct goals often leads to trade-offs that can significantly undermine its own key priorities, such as housing affordability. This is demonstrated by the impact of constrained land supply in high-demand urban areas, which drives up land prices. When combined with other rising construction input costs, the limited availability of buildable land helps explain why housing affordability for working families has substantially eroded despite an increase in relative housing stock.
By quantifying the geographic limits imposed by UGA boundaries, this report adds a critical dimension to the housing affordability conversation. Genuinely addressing the affordability crisis may likely require re-evaluating land-use policies, especially those which dramatically limit where and how much housing can be built.
Methodological Approach, Assumptions, and Limitations
This report began by showing that housing units built have exceeded population growth, while noting that demand per capita has increased. Many common methodologies, such as Freddie Mac’s Housing Shortage: State of the States formula conclude there is a significant housing shortage. These findings are not contradictory. Formulas such as Freddie Mac’s identify a present-day shortfall based on how many homes would be needed if affordability weren’t constraining household formation. These estimates are useful as they reflect current market conditions, including Washington’s high construction and land costs. However, the finding that housing units constructed exceeded population growth is also useful, as it demonstrates rising cost inputs, less so than simple physical undersupply, are driving high housing costs.
To quantify the extent of land constrained by Urban Growth Areas in Washington state, this report relied primarily on geographic data from the U.S. Census Bureau’s 2020 Census Urban Growth Area (UGA) TIGER/Line shapefiles. Washington State housing units and population were obtained via the U.S. Census Bureau.
These shapefiles are part of the Master Address File/Topologically Integrated Geographic Encoding and Referencing (MAF/TIGER) Database (MTDB), a national geographic dataset maintained by the Census Bureau. The UGA boundaries represented in these files are legally defined and were delineated cooperatively by state and local officials as of January 1, 2020.
Using GIS software, we overlaid the UGA shapefiles onto a base map of Washington. We then summed the total land area contained within all UGAs statewide and calculated this as a percentage of Washington’s total landmass.
Limitations of this approach include:
- The UGA dataset reflects boundaries as of 2020 and may not capture any changes or expansions since then.
- While UGAs indicate where urban growth is intended, the analysis does not account for other factors influencing developability such as critical areas, environmental restrictions, regulatory land exactions, or infrastructure availability within these same UGAs. Meaning, the amount of developable land in UGAs is less than this report outlines.
Assumptions:
- Quantifying the exact impact of Urban Growth Areas on land values is challenging, in part because they are relatively uncommon and implemented inconsistently across jurisdictions. Despite this, peer reviewed research suggests that restricting urban growth areas can significantly increase land values and affect housing affordability (Cho et al.; Ball et al.; Zorn et al.). However, a more recent and comprehensive statewide analysis would provide stronger empirical clarity on the link between UGA restrictions and housing prices in Washington state.
Despite these limitations and assumptions, this method provides a clear estimate of how much land is designated for urban growth in Washington state, forming a foundation to understand the fundamental supply-side constraint affecting housing affordability.
Results
Our GIS analysis shows that just 3.74% of Washington state’s land lies within designated Urban Growth Areas, where the GMA concentrates most urban development. This limited footprint significantly restricts where new housing can be built. Although the number of housing units has increased by 67% since 1990, outpacing population growth, this expansion has occurred within a small portion of the state.
The map below highlights these findings. Areas marked in red represent land within UGAs, showing how urban growth is geographically concentrated.
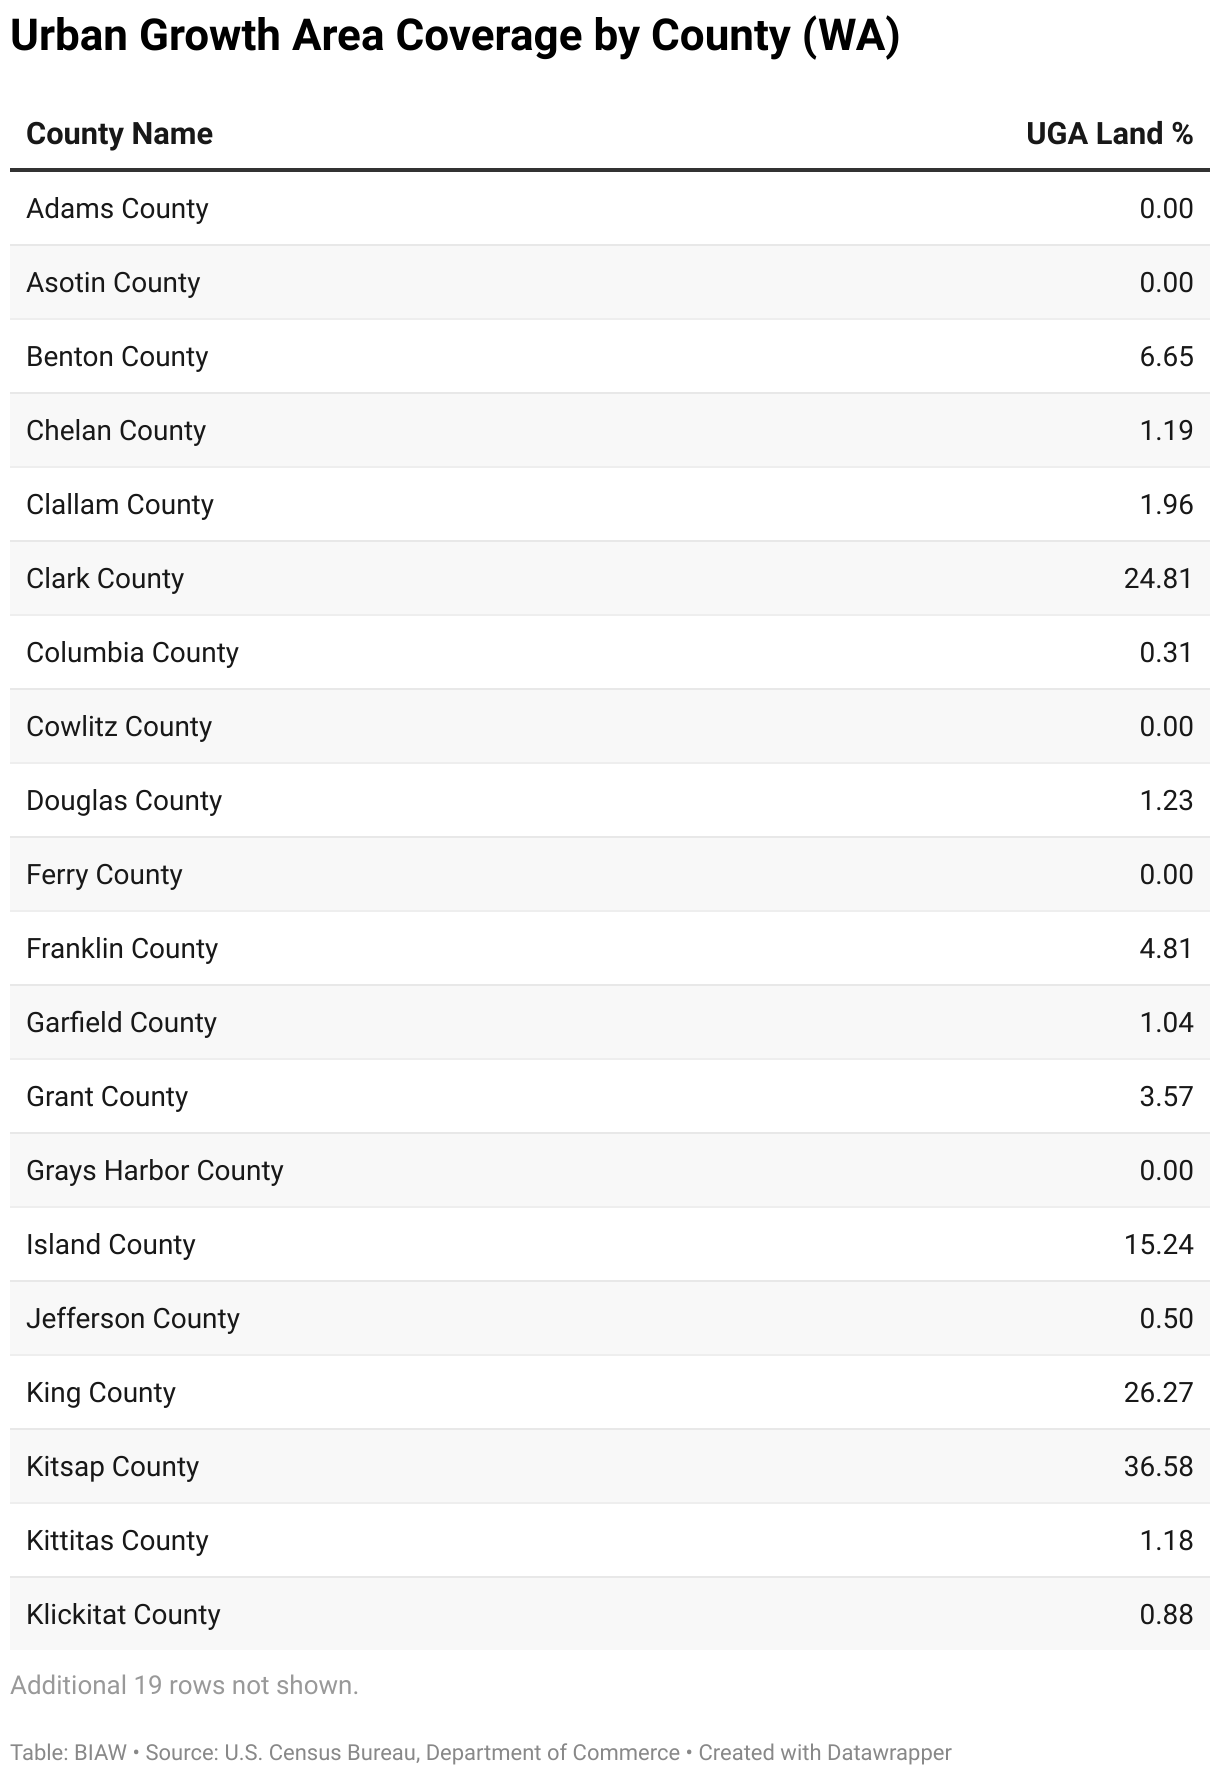
The table below shows the percentage of land within UGAs for each Washington county. Several rural counties do not plan under the GMA and have no UGAs— these contribute to the low statewide average of 3.7%. While some of the state's most populous counties have a higher share of UGA land, most still have less than 25% of their total area designated as UGA, with Kitsap County the only one exceeding 30%.
Policy Implications and Recommendations
The U.S. Census Bureau projects that the national population will peak around 2080 at nearly 370 million before beginning to decline (U.S. Census Bureau-c). Washington state may continue to outpace national growth, with the Office of Financial Management projecting Washington’s population to increase 27% over the next thirty years, which is significant, but notably much slower than the 65% growth seen since 1990. (Office of Financial Management-c)
Given these long-term demographic shifts, strategic, data-driven adjustments to UGAs would better reflect the state’s recent exceptional population growth and housing demands. Such adjustments would help alleviate pressure on land prices and make housing more affordable without compromising the other goals of the Growth Management Act.
It’s worth acknowledging that there are political and community concerns surrounding growth boundary expansions. These include fears of sprawl, environmental impacts, and defensive localism or “NIMBYism.”However, expanding UGAs does not inherently lead to low-density development or unchecked sprawl. In fact, expanding UGAs would not necessarily require development on new UGA land to result in price relief. Thoughtful growth management can balance the need for additional developable land with protection for critical natural and agricultural areas.
Several policy tools exist to implement strategic growth boundary adjustments. Representative Connors’ bill, HB 1164 (2025–26), provides a concrete example. Under this bill, cities and counties planning under the Growth Management Act must expand UGA boundaries during their next comprehensive plan update to include parcels adjacent to existing UGAs that are already developed or approved for residential use and have access to or plans for urban services. This approach prioritizes logical modest expansion while protecting critical areas such as agricultural lands, forests, and water sources.
There are several other policy reforms that are also worth exploring. One strongly recommended idea is to conduct an independent comprehensive study assessing the impact of Urban Growth Areas on housing markets, which could provide valuable insight into future policymaking. Another proposal is for the legislature to consider creating an intermediate zoning classification, such as a suburban designation, to allow for increased density into newly expanded UGAs without fully urbanizing areas. Additionally, there could be a review of funding mechanisms available to local jurisdictions, particularly in the form of grants aimed at enhancing municipal services in preparation for UGA expansion. This could include a broader evaluation of the return on investment for other grants aimed at increasing housing affordability.
Another potential proposal is for the legislature to consider adopting a 'no net loss of usable UGA land' policy. Under this approach, when a locality enacts environmental protections, such as tree retention ordinances, it must ensure there is no overall reduction in land available for housing. If such measures reduce the amount of buildable land, the locality then must periodically expand the Urban Growth Area to compensate for the reduced supply. Finally, lawmakers could explore the possibility of mandating or incentivizing UGA expansions in counties facing severe housing affordability challenges.
Complementing Urban Growth Area boundary adjustments with continued efforts to reduce other construction input costs, including streamlining regulations, removing restrictive zoning requirements, addressing labor shortages, and improving material supply chains, can further enhance housing affordability. In this way, Washington can pursue a balanced, multi-faceted strategy: building more housing to meet demand, making housing cost components more affordable, and expanding land supply responsibly.
Sources
- Ball, Michael & Cigdem, Melek & Taylor, Elizabeth & Wood, Gavin. (2014). Urban Growth Boundaries and their Impact on Land Prices. Environment and Planning A. 46. 3010-3026. 10.1068/a130110p.
- Cho, Seong-Hoon & Chen, Zhuo & Yen, Steven. (2008). Urban Growth Boundary and Housing Prices: The Case of Knox County, Tennessee. Zhuo Chen. 38. 10.52324/001c.8252.
- “Historical Estimates of April 1 Population and Housing for the State, Counties, and Cities.” Office of Financial Management-a, https://ofm.wa.gov/washington-data-research/population-demographics/population-estimates/historical-estimates-april-1-population-and-housing-state-counties-and-cities?
- “Median Household Income Estimates.” Office of Financial Management-b. https://ofm.wa.gov/washington-data-research/economy-and-labor-force/median-household-income-estimates.
- “Forecast of the State Population,” Office of Financial Management-c. https://ofm.wa.gov/sites/default/files/public/dataresearch/pop/stfc/stfc_2023.pdf
- United States Census Bureau–a. Washington Profile. https://data.census.gov/profile/Washington?g=040XX00US53.
- U.S. Census Bureau–b. Historical Median Home Values (Unadjusted), Time Series Data. https://www2.census.gov/programs-surveys/decennial/tables/time-series/coh-values/values-unadj.txt.
- “U.S. Census Bureau, Department of Commerce - TIGER/Line Shapefile, Current, State, Washington, 2020 Census Urban Growth Area (UGA).” Data.Gov, https://catalog.data.gov/dataset/tiger-line-shapefile-current-state-washington-2020-census-urban-growth-area-uga?.
- U.S. Census Bureau-c. “U.S. Population Projected to Begin Declining in Second Half of Century.” Census.Gov, 9 Nov. 2023, https://www.census.gov/newsroom/press-releases/2023/population-projections.html.
- “WAOFM - April 1 - Population by State, County and City, 1990 to Present.” State of Washington, 26 June 2019, https://data.wa.gov/demographics/WAOFM-April-1-Population-by-State-County-and-City-/2hia-rqet/about_data.
- “Washington Employment Estimates (WA-QB &CES).” Employment Security Department, https://esd.wa.gov/jobs-and-training/labor-market-information/employment-and-wages/washington-employment-estimates-wa-qb-ces.
- “Washington Housing Market: 2025 Home Prices & Trends.” Zillow, https://www.zillow.com/home values/59/wa/.
- Washington State Legislature. House Bill 1108: Creating a Task Force on Housing Cost Driver Analysis. 2025–26 Reg. Sess., Engrossed 2nd Substitute, 2025. Washington State Legislature, https://app.leg.wa.gov/billsummary?BillNumber=1108&Year=2025.
- Washington State Legislature. HB 1164 - Expanding Urban Growth Area Boundaries for Residential Development. 2025-2026, introduced 6 Jan. 2025, Washington State Legislature, House Committee on Local Government, 28 Jan. 2025, https://app.leg.wa.gov/billsummary?BillNumber=1164&Year=2025.
- Zorn, Peter M., Dennis E. Hansen, and Stephen I. Schwartz. "Mitigating the Price Effects of Growth Control: A Case Study of Davis, California." Land Economics, vol. 62, no. 1, 1986, JSTOR, https://doi.org/10.2307/3146562.
Disclaimer
The content in this report is intended for informational purposes only. The information contained in this report may not constitute the most up-to-date economic, housing, or other information, nor does it represent a complete assessment of the housing market. This report does not constitute any recommendation or solicitation to any person to enter into any transaction or to adopt any investment strategy. Any business or investment decisions should not be based purely on the information presented in this report. Readers are encouraged to seek independent professional investment, legal, and/or tax advice. All liability with respect to actions taken or not taken based on the contents of this report are hereby expressly disclaimed. The content is provided "as is;" no representations are made that the content is error-free.