Q3 2025 Housing Attainability Index in Washington State
Formerly the Housing Affordability Index
Background
The Housing Attainability Index, formerly the Housing Affordability Index, is a recurring Washington-based resource for understanding whether county-level housing markets are providing a range of choices that are affordable – and thus, attainable – to the state’s workforce.
Historically, the homebuilding industry relied on the National Association of Home Builders’ “Priced-Out Report” as an indicator of housing market health. However, as construction costs have climbed to record levels due to an aging workforce, escalating land prices, and supply chain disruptions, the number of families priced out with each $1,000 increase in home prices tells only part of the story.
Executive Summary
Housing affordability continues to permeate conversations as the 2026 legislative session approaches. Recent economic shifts, including a long-anticipated interest rate cut, have renewed attention on the housing market, but the effects remain uneven. Mortgage rates have eased from recent highs, prompting some homeowners to refinance, yet prospective buyers still face significant barriers.
Home prices remain elevated, inventory is constrained, and broader economic uncertainty continues to weigh on both buyers and sellers. Since our March 2025 update, which found that 80% of Washingtonians cannot afford a home, modest improvements in housing affordability have emerged, driven by low home price appreciation and declining interest rates.
While the Legislature has declared yet another “Year of Housing,” these efforts have yet to meaningfully close the affordability gap for Washingtonians. Legislation is not implemented overnight and some of the most consequential bills designed to increase housing supply such as HB 1110: Middle Housing, HB 1096: Lot Splitting, and SB 5290: Consolidated Permit Review, will begin full implementation in the coming months. However, with the long-term goal of 1.1 million new homes over the next two decades still in view, lawmakers head into the upcoming session under growing pressure to move beyond incremental progress and take more decisive action to meet the scale of the crisis.
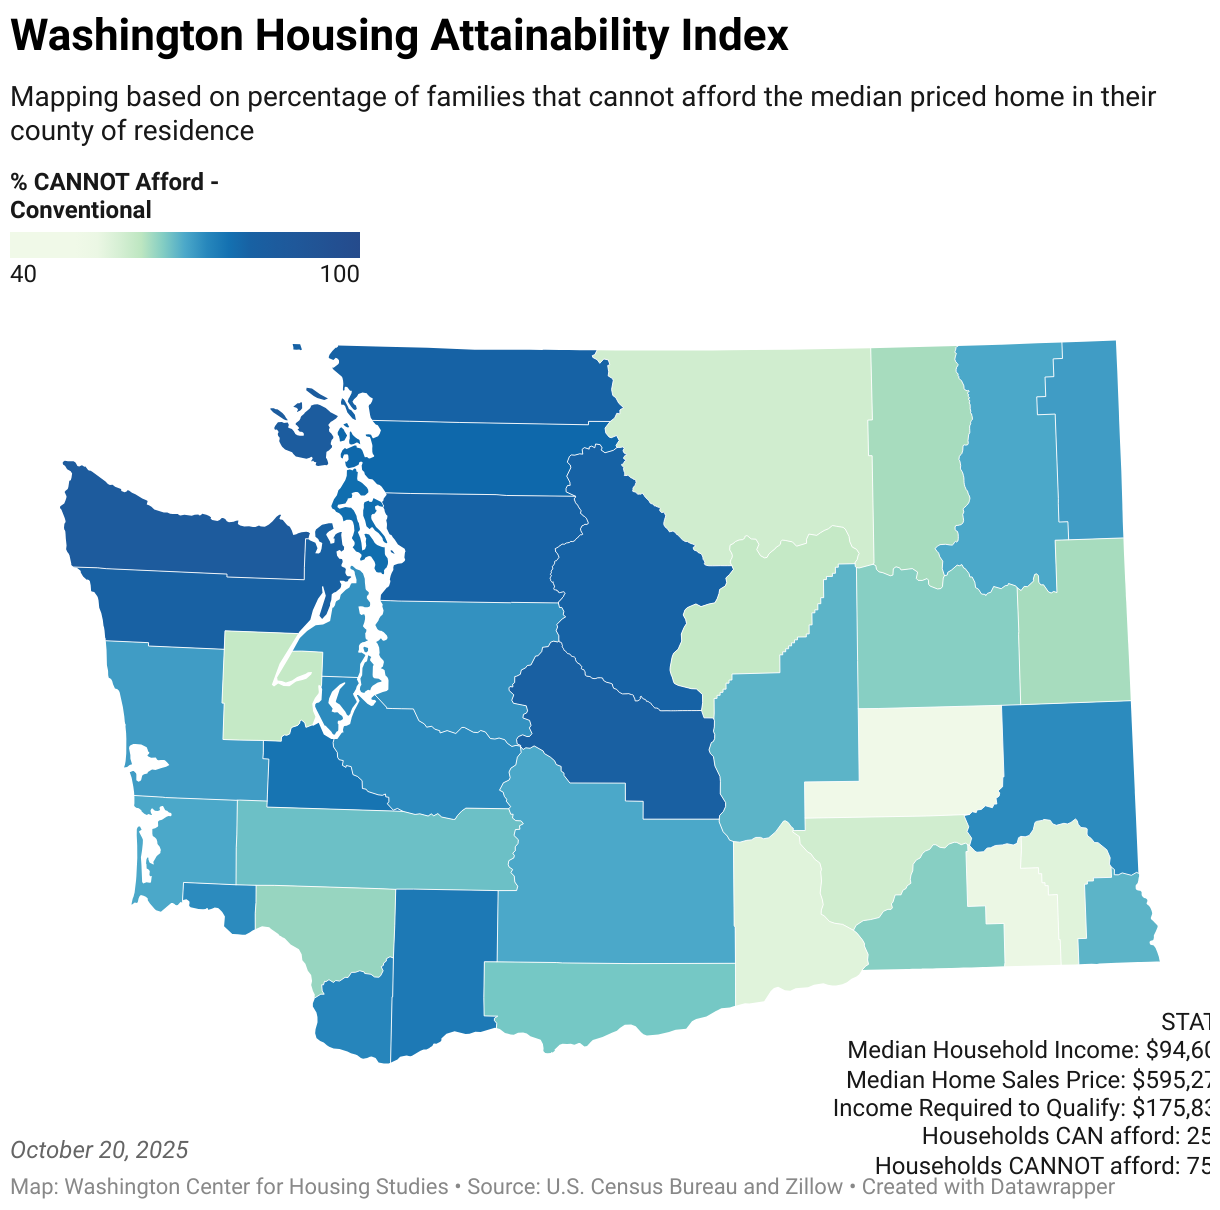
In this study, we find that home ownership is unaffordable for 75% of Washington families, as the average percentage of area median income required to qualify for a loan is 186% or $175,835. However, the average Washington state household only earns $94,605, approximately half the income required to qualify for a median-priced home, which costs on average across the state $595,271.

Methodological Approach, Assumptions, and Limitations
The Housing Attainability Index methodology remains unchanged from our March update. It utilizes a modified mortgage affordability formula incorporating Federal Housing Administration (FHA) guidelines and property insurance, which assumes that 28% of household income is allocated to mortgage payments and that the household has 3% of the home’s purchase price readily available for a down payment. It also does not account for monthly personal debt payments or homeowners’ association fees, which can vary significantly from household to household.
We gathered data from publicly available sources, including the US Census Bureau, the Bureau of Labor Statistics, and Zillow. After gathering data, we completed calculations for determining affordability based on the following data assumptions:
- The average credit score range for Washington consumers is 722, according to Equifax.
- Home sales price by county as reported by Zillow Market Report, the most recent data set available at the time of data pull.
- The average property tax levy rate reported by the Department of Revenue is $8.93 per $1,000 of assessed value. This average, calculated across all counties, is based on the median home value and the typical annual property tax payment. Consequently, homes assessed above the median home value will be less affordable for buyers.
- Interest rates were accessed on October 6 and may not be based upon today’s rates. For reference, the average interest rate reported was 6.24% based on a 722-credit score.
Our analysis shows that an income of $175,835 is needed to qualify for an FHA loan at the median home sales price in Washington state. While U.S. Census income tables provide essential data, they lack highly detailed income distribution information, particularly at higher income levels.
According to Census Estimates, 358,622 Washington residents reported household incomes between $150,000 and $199,999 (US Census Bureau-a). To estimate the number of households earning above $175,000, we assumed that approximately half of those in the $150,000–$199,999 range earned $175,000 or above.
We then added this figure to the total number of households earning $200,000 or more. Based on this methodology, roughly 25% of Washington households earn $175,000 or more annually. Consequently, approximately 75% of residents fall below the income threshold typically required to qualify for an FHA loan to purchase a home at the state's median price without being classified as “cost burdened.”
For county income data, we utilized the American Community Survey (ACS) Table S1901, specifically the 2023 ACS 5-Year Estimates Subject Tables. Even though they’re not free from limitations, these assumptions help us tailor affordability rates to each county’s economic reality, rather than holding all variables constant across the state. Accounting for county differences is crucial to providing the most realistic illustration of affordability for each county.
Results
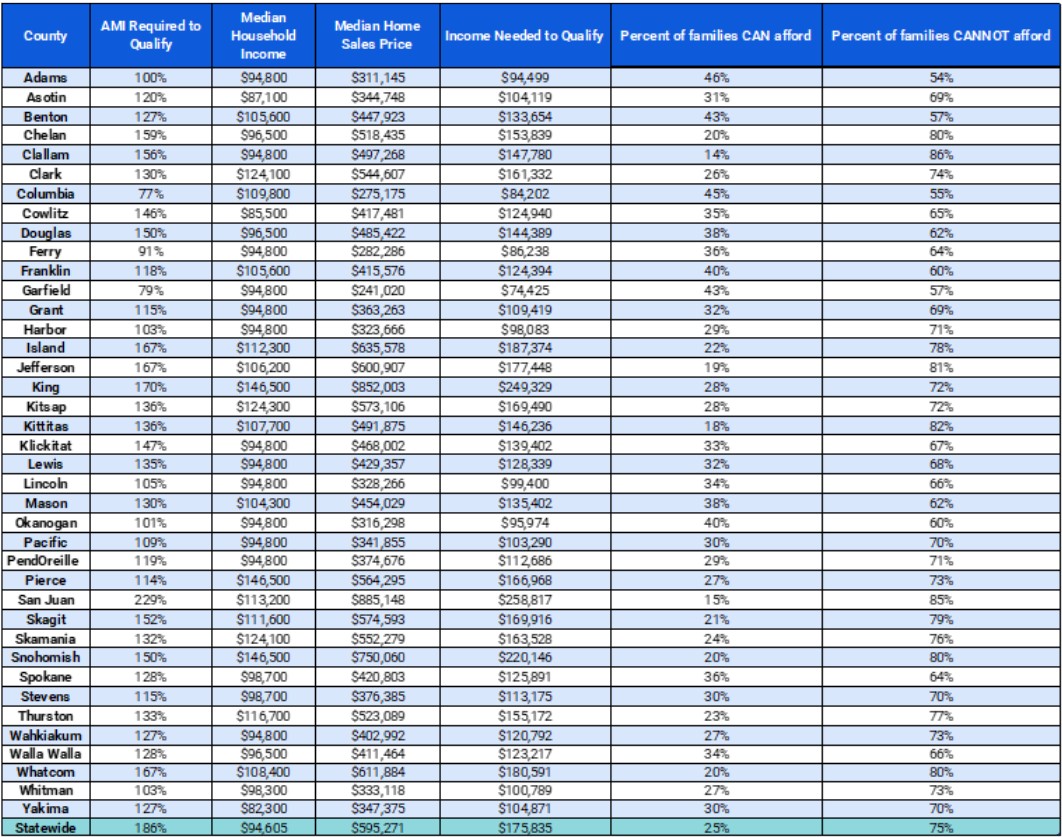
In the Housing Attainability Index table, you will find crucial information useful for understanding the health of the state’s housing market. For now, we will turn the discussion to key findings.
The area median income (AMI) required to qualify for a mortgage is well above the established 50% and 80% AMI limits for qualification for many of the available affordable housing programs. When we consider that oftentimes in order to purchase the median home in Washington state, at a cost of $595,271, you must, on average, earn 186% of AMI (or $94,605 per year) and have a hefty savings account to apply towards a down payment (to the tune of $20,834 for a 3.5% downpayment), this underscores the widening gap between Washington’s stated housing policy goals and the lived economic conditions of working families.
Housing Attainability Index [March 2025]
The graph below illustrates the percentage of families that can and cannot afford the median-priced home in each county. At the state level, only 25% of Washington families can afford the median-priced home; this statistic includes existing homeowners as well, operating on the assumption that these homeowners may someday sell their home and need to purchase another home.
Policy Implications and Recommendations
While declining interest rates and lower home-value appreciation may continue to ease housing affordability on the margins, state and local governments possess tools that can better ensure homeownership can once again become a realistic opportunity for the current generation of Washington families.
Land Supply
Washington’s housing affordability crisis is often attributed to the under-construction of homes. Often overlooked are the rising construction costs of homebuilding. A major contributor is land scarcity, particularly within Urban Growth Areas (UGAs), which make up just 3.74% of the state’s landmass under the Growth Management Act (GMA). These boundaries, intended to limit sprawl and protect natural resources, have restricted the supply of developable land in high-demand regions—driving land prices up and making housing less attainable. State Rep. April Connors’ HB 1164 proposes a targeted expansion of UGAs during local comprehensive plan updates, allowing adjacent parcels already developed or approved for residential use to be included. This approach enables logical, modest growth while preserving critical environmental protections. Without addressing rising land costs driven by scarcity, Washington would face an exceedingly impossible challenge—needing to build homes at a pace far beyond anything seen before to make housing affordable for working families.
Infrastructure Funding
Essential infrastructure remains unpredictable and poorly understood, posing a major barrier to expanding buildable land. Washington lacks a comprehensive dataset on underground infrastructure, and more critically, state funding for essential infrastructure is inconsistent.
The Public Works Trust Fund (PWTF), now known as the Public Works Assistance Fund, was once a cornerstone of local infrastructure financing, but has been significantly weakened by revenue diversions. As a result, many jurisdictions, particularly smaller and rural communities, lack viable options to repair or expand critical facilities. Fully restoring the fund could offer a stronger return on investment for achieving housing affordability using state-allocated funds than its affordable housing projects and could also support more comprehensive and effective policymaking. Similarly, the Connecting Housing to Infrastructure Program (CHIP), administered by the Department of Commerce, has played an important role in aligning housing development with utility infrastructure. However, its impact is limited by its current focus on individual projects. By increasing CHIP funding and expanding its scope to support larger-scale, strategic infrastructure initiatives, the state could lower development costs and accelerate the delivery of affordable housing.
Building & Energy Code Changes
Washington has the most stringent energy code in the nation, based on analysis from the Office of Energy Efficiency & Renewable Energy in the U.S. Department of Energy. Most other states adopt less modified versions of the International Energy Conservation Code (IECC).
Washington’s State Building Code Council (SBCC) was given the authority to transition from our unique state code to the IECC, but they have chosen to retain much of our unique code instead of adopting the IECC by reference and amending it only as necessary.
Having a unique state code makes it harder, or impossible, for builders and enforcement to use national resources and tools to make compliance with the IECC easier. Builders meeting certain federal programs must also comply with the IECC, which our state code regularly differs from. Our state code is also anti-energy-choice and penalizes and discourages the use of natural gas, making it less affordable to build. This pushes new homes towards being all-electric, which can increase energy bills for Washingtonians. Switching to a cleaner adoption of the IECC would still allow for a high level of energy efficiency in new construction, while providing more options for training and compliance.
Code updates typically occur on a three-year cycle. This means that every few years builders must create new standard designs and retrain to use new methods, which slows down building and add new costs to construction. Recognizing these challenges, California recently enacted a six-year pause on new building code updates to improve housing affordability. Washington should take a similar approach, pause code updates and move from a three-year to a six-year code cycle, to provide greater stability and reduce design and compliance costs. A longer cycle allows builders to refine their practices, capture efficiencies, and pass those savings on to homeowners.
Additionally, reforming the State Building Code Council (SBCC) to include broader private-sector representation—such as was proposed by Sen. Shelly Short in Senate Bill 5429—would ensure that code decisions better reflect real-world construction experience. Aligning Washington’s code standards, governance, and processes with practical, affordable approaches would enhance both energy performance and housing affordability statewide.
Sources
- “Area Median Income and Property Eligibility Tool.” Freddie-Mac Single Family, Freddie Mac, https://sf.freddiemac.com/working-with-us/affordable-lending/area-median-income-and-property-eligibility-tool. Accessed 14 Oct. 2025.
- Cox-Steib, Joshua. “Home Insurance Rates by State for October 2025.” Bankrate.Com, 25 July 2023, https://www.bankrate.com/insurance/homeowners-insurance/states/.
- Average levy rates by county interactive data graphic. (n.d.). Washington Department of Revenue. Retrieved February 11, 2025, from https://dor.wa.gov/about/statistics-reports/average-levy-rates-county-interactive-data-graphic
- U.S. Census Bureau. "Household Income in the Past 12 Months (in 2024 Inflation-Adjusted Dollars)." American Community Survey, ACS 1-Year Estimates Detailed Tables, Table B19001, https://data.census.gov/table/ACSDT1Y2024.B19001?q=B19001:Household+Income+in+the+Past+12+Months+(in+2024+Inflation-Adjusted+Dollars)&g=040XX00US53&y=2024.
- U.S. Census Bureau, U.S. Department of Commerce. "Income in the Past 12 Months (in 2023 Inflation-Adjusted Dollars)." American Community Survey, ACS 5-Year Estimates Subject Tables, Table S1901, https://data.census.gov/table/ACSST5Y2023.S1901?q=household income&g=040XX00US53$0500000.
- Washington State housing market: 2025 home prices & trends. (n.d.). Zillow. Retrieved February 11, 2025, from https://www.zillow.com/home-values
- What is an FHA loan? (n.d.). Zillow. Retrieved February 11, 2025, from https://www.zillow.com/mortgage-rates/fha-mortgage-rates/
Disclaimer
The content in this report is intended for informational purposes only. The information contained in this report may not constitute the most up-to-date economic, housing, or other information, nor does it represent a complete assessment of the housing market. This report does not constitute any recommendation or solicitation to any person to enter into any transaction or to adopt any investment strategy. Any business or investment decisions should not be based purely on the information presented in this report. Readers are encouraged to seek independent professional investment, legal, and/or tax advice. All liability with respect to actions taken or not taken based on the contents of this report are hereby expressly disclaimed. The content is provided "as is;" no representations are made that the content is error-free.