
Washington State's Housing Attainability Index: Q2 2026
Housing Affordability in Washington

Background
The Housing Attainability Index is a recurring Washington-based resource for assessing whether county-level housing markets provide a range of housing choices that are affordable—and therefore attainable—for the state’s workforce.
Executive Summary
Inflation continues to shape the broader economic outlook as prices rise across multiple sectors. Annual overall inflation has hovered around 3.5 percent since spring, hitting the highest rate since May 2023, tempering earlier expectations for rate cuts in 2026. Shelter inflation remains slightly below both overall inflation and wage growth, suggesting modest continued gains in housing affordability, largely attributed to interest rate reductions. Even so, Washington home prices remain well beyond the reach of median-wage households who do not possess existing financial assets.
Given concerns about inflation, new taxes, and the potential for higher interest rates, current attainability metrics may represent a near-term high-water mark unless structural changes improve underlying market conditions.
Since the November 2025 update, interest rates have declined slightly, while wages and median home prices have each increased marginally. Despite these changes, homeownership attainability remains essentially unchanged. Homeownership remains unaffordable for roughly 75% of Washington families: on average, a household must earn approximately 177% of area median income (AMI), or about $175,000 annually, to qualify for a loan on a median-priced home. By contrast, the median Washington household earns approximately $99,839—well below the income needed to purchase the median-priced home at a price of approximately $601,016.
Methodological Approach, Assumptions, and Limitations
The Housing Attainability Index (HAI) methodology remains unchanged from our October 2025 update. The index utilizes a mortgage affordability formula based on Federal Housing Administration (FHA) guidelines and property insurance assumptions. Specifically, the methodology assumes that 28% of household income is allocated toward mortgage payments and that a household has cash available for a down payment equal to 3% of the home’s purchase price.
For a median-priced home in Washington State, a 3% down payment equates to $21,036. While many households in Washington may possess existing home equity or other financial assets exceeding this amount, the HAI assumes that the median household has only $21,036 in readily available cash for a down payment. This assumption is intended to reflect current market conditions faced by prospective homebuyers. This approach remains unchanged from prior updates and aligns with the longstanding purpose of the HAI: to measure housing attainability based on Washington’s current economic conditions, rather than historical economic conditions that enabled some households to accumulate greater housing wealth. Likewise, the index does not account for monthly personal debt payments or homeowners’ association fees, which can vary significantly from household to household.
We gathered data from publicly available sources, including the US Census Bureau, the Bureau of Labor Statistics, and Zillow. After gathering data, we completed calculations for determining affordability based on the following data assumptions:
- Washington consumers maintain credit scores broadly on par with the national average, according to Equifax.
- Interest rates were accessed on May 30 and may differ from current rates. The average interest rate used in the analysis was 6.12%.
- County-level home sales prices reflect the Zillow Market Report, the most recent dataset available at the time of data collection.
- The average property tax levy rate reported by the Department of Revenue is $8.96 per $1,000 of assessed value. This average, calculated across all counties, is based on the median home value and the typical annual property tax payment. Consequently, homes assessed above the median home value will be less affordable for buyers.
Our analysis shows that an annual household income of $175,678 is needed to qualify for an FHA loan at the median home sales price in Washington state.
While U.S. Census income tables provide essential data, they lack highly detailed income distribution information, particularly at higher income levels. According to Census Estimates, roughly 11% of Washington households reported incomes between $150,000 and $199,999. To estimate the number of households earning above $175,000, we assumed that approximately half of those (5.5%) in the $150,000–$199,999 range earned $175,000 or above.
We then added this figure to the roughly 19% of households earning $200,000 or more. Based on this methodology, roughly 25% of Washington households earn $175,000 or more annually. Consequently, approximately 75% of residents fall below the income threshold typically required to qualify for an FHA loan to purchase a home at the state's median price without being classified as “cost burdened.” The graphic below illustrate Washington’s household income distribution.
For county income data, we utilized the Census Bureau’s American Community Survey (ACS) Table S1901, specifically the 2024 ACS 5-Year Estimates Subject Tables. While not free from limitations, these assumptions helped us tailor affordability rates to each county’s economic reality, rather than holding all variables constant across the state. Accounting for county differences is crucial to providing the most realistic illustration of affordability for each county.
Results
In the Housing Attainability Index table, you will find crucial information that can be used to understand the health of the state’s housing market. For now, we will turn the discussion to key findings.
To afford a median-priced home in Washington State, a household must earn approximately $175,678 annually—about 177% of the state’s Area Median Income (AMI)—and have at least $21,036 available for a 3% down payment. These findings underscore the severity of Washington’s housing attainability challenge. At the state level, only about 25% of households can afford the median-priced home under current market conditions, leaving approximately 75% priced out of ownership.
Housing Attainability Index [July 2026]
The graph below illustrates the percentage of families that can and cannot afford the median-priced home in each county. As expected, counties in Eastern Washington tend to be more affordable than their counterparts along the Puget Sound, with rural counties being more affordable on each side of the state. Of the 10 most populated counties in Washington, Yakima County remains the most affordable, requiring a household income of only 127% AMI to afford the median priced home. At the state level, only 25% of Washington families can afford the median-priced home.
Policy Implications and Recommendations
The affordability trends documented in this report indicate that homeownership remains unattainable for many Washington families. As housing costs have priced out a large share of prospective buyers, policymakers and economists have increasingly drawn attention to a striking contrast: many consumer goods have become less expensive over time, while many essentials, such as housing have become more difficult to attain.

One explanation is the uneven pace of productivity growth across sectors. In consumer goods, productivity gains have often come from automation, standardization, repetition, and scale efficiencies. The most clear and familiar example historically is Henry Ford’s moving assembly line, which reorganized automobile production into a sequence of repeatable tasks. By reducing Model T assembly time from more than 12 hours to about 90 minutes, Ford made it possible to produce cars at far greater volume and at substantially lower prices.
Residential construction has not experienced a comparable transformation. Homes are still built on specific sites, under local rules, with changing conditions, separate approvals, and limited opportunities for repetition. Unfortunately, homebuilding efficiency has actually regressed. The industry often operates in an environment where the basic conditions for assembly-line efficiency: predictability, repetition, and scale, are increasingly difficult to maintain.
Regardless of which measure we choose, we get the same conclusion: productivity in construction has been stagnant or declining for decades. The main strategies we have to address this are policy changes which can push particularly inefficient places to the efficient frontier... — Brian Potter, On Labor Productivity in Construction, Aspen Institute
Much of the modern discussion of this productivity gap focuses on technology: manufactured housing, modular construction, factory-built components, and the search for a “Henry Ford of housing.” These innovations may help. Yet the comparison to Ford also points to an important limitation. The assembly line did not succeed only because of new machinery; it succeeded because the production environment allowed tasks to be repeated in sequence, at scale, with minimal disruption. Housing policy should therefore ask not only how homes are built, but whether the regulatory environment allows efficient building practices to take root.
This question is not merely theoretical. Models of large-scale homebuilding existed in America; most famously the Levittown approach associated with William Levitt and his construction company, Levitt and Sons, applying assembly-line logic to on-site construction by organizing workers around specialized, repeatable tasks across many similar homes.
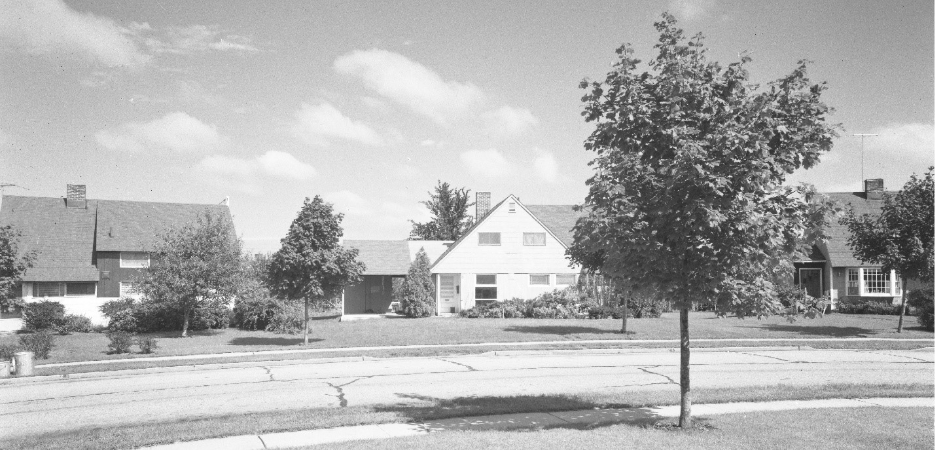
The process was divided into 26 specialized tasks, creating a "reverse assembly line" where crews moved from house to house. At its peak, Levitt and Sons were completing 36 homes in Levittown in a single day. The model was imperfect and historically specific, but it illustrates a central point for housing policy: efficiency depends on more than construction technique. So, what stands in the way of efficient housing, again?
Reason #1: Frequent Code Changes Reduce Predictability
Building codes serve an important public purpose by establishing minimum standards for safety, durability, and construction quality. Since 1994, the International Code Council (ICC) has published model building codes, including the International Residential Code and the International Energy Code. Most states, including Washington, generally adopt these codes through public rulemaking processes, often with state-specific amendments.
While clear national regulatory standards can enable homebuilders to build safe and affordable homes across the country, many benefits of these national standards are unfortunately undermined by the frequency of code changes. The ICC publishes new model codes every three years and many states, including Washington, likewise adopt their statewide codes on a three-year cycle.
“When the process of creating the 2027 edition of the I‑Codes began, no jurisdictions had yet adopted the 2024 codes. Some large jurisdictions are still using the 2015 IBC. Rapid changes help the ICC sell codes, but they don’t provide time for codes’ unintended consequences to be revealed.” — Emily Hamilton, Reforming US Building Codes, Cato Institute
The value of a centralized code system depends not only on what it requires, but also on whether those requirements remain stable long enough for builders, suppliers, and local permitting staff to develop repeatable safe practices. Constant changes interrupt the learning curve and require new training, revised plans, altered supply chains, and additional compliance review, making it harder to build efficiently and safely from one project to the next.
Washington’s energy code is a significant part of this discussion. The added regulatory costs from building codes since 2009 is $39,876, with a majority of that amount associated with the State’s energy code, which is the most stringent in the nation. This does not diminish the importance of energy performance goals, but it provides an example of how a continuous layering of regulations can contribute to the cost of a good no longer being attainable for a majority of households.
A more deliberate code-adoption schedule would allow policymakers to evaluate implementation effects before layering on additional requirements. Several states, including Delaware, Hawaii, and California, have adopted pauses on code updates. Washington considered a similar approach, with the bipartisan bill HB 2141, (2025-26), which would have reduced code update intervals and provided a 10-year pause on future code updates, but the bill failed to advance out of committee. Future policy discussions should reconsider whether longer implementation periods, stronger cost review, or temporary pauses could improve predictability without undermining legitimate safety and performance standards.
Reason #2: Land Scarcity Limits Economies of Scale
“Mass production — repetition — makes things cheap… But land‑use regulation stops us from building a mass‑produced home and requires instead a very idiosyncratic home.” — Edward Glaeser, Is small thinking the new American way?, Harvard
The assembly-line principle is simple: repetition makes production cheaper. In housing, repetition depends heavily on land availability. Larger subdivisions and master-planned communities allow fixed costs, including planning, engineering, project management, and marketing, to be spread across more units. They also allow builders to purchase materials, labor, and services in greater quantities. When buildable land is scarce, housing production shifts toward smaller, more complex, and more expensive projects
The Levittown model could simply not have worked without access to large tracts of land in a single area and the ability to coordinate large numbers of specialized subcontractors who could move efficiently from one house to another.
"The rule for the assembly line is simple, place the tools and the men in the sequence of the operation so that each part shall travel the minimum distance possible.” — Henry Ford, My Life and Work, 1922
Washington’s Growth Management Act (GMA), adopted in 1990, fundamentally changed the state’s land-use framework through the use of urban growth areas (UGAs). Outside UGAs, residential subdivisions are generally prohibited. Today, only 3.74% of Washington’s land is located inside UGAs and therefore subdividable. As a result, large tracts of undeveloped land available for both suburban and dense residential development have become increasingly scarce and expensive.
This constraint has direct implications for housing attainability because land scarcity limits the ability of builders to achieve scale. It also weakens the conditions that once made large-scale, repeatable homebuilding possible. Legislative proposals to modestly increase statewide UGAs have not received full consideration. Representative Connors’ bill HB 1164 (2025–26) would have required GMA-planning jurisdictions to expand UGAs to include certain adjacent residentially developed or approved parcels with urban services. However, it failed to advance out of committee.
Policy options exist which focus on targeted land availability and recognize both the value of comprehensive GMA goals while balancing the need for a land base sufficient to support attainable housing production. These policies should be considered more seriously by lawmakers in the future.
Reason #3: Permitting Delays Interrupt the Production Sequence
The assembly line depends on sequence. Each step must occur in a predictable order, with limited delay between stages. Homebuilding is different in important ways, but the same general principle applies: efficiency falls when long periods of uncertainty are inserted between planning, approval, and construction. Lengthy or inconsistent permitting increases carrying costs, delays production, and makes it more difficult for builders to plan projects with confidence.
Washington has taken initial steps to address this issue. SB 5290 (2023) requires local governments to streamline land-use permit review, establish firmer approval timelines, encourage consolidated permit processing, and create accountability measures when deadlines are missed. The early 2025 implementation report from the Washington State Department of Commerce shows modest improvement: median permit review times improved by approximately 19% compared with the 2024 baseline.
Although this progress is meaningful, permit performance remains uneven across permit categories and jurisdictions and will require continued implementation support.
Clear and objective development standards are a related industry priority for improving predictability and delay avoidance. SB 5613 (2025-26) would’ve required local governments to implement standards that are understandable and uniformly applicable, reducing the subjective interpretations which often cause delays and inconsistent approvals. Solutions to reduce discretionary uncertainty while maintaining appropriate local review ought to remain a statewide policy goal moving forward.
Taken together, these recommendations return to the same production-side theme. Efficiency depends on repetition, scale, and predictable sequencing. Code instability, land scarcity, and permitting standard uncertainty each weaken those conditions. A durable housing attainability strategy should therefore evaluate policy not only by its stated goals, but also by whether it allows Washington’s housing production system to build more homes at the pace, cost, and scale required by the state’s households.

Sources
- “30-Year Fixed Rate Mortgage Average in the United States.” FRED Economic Data, Federal Reserve Bank of St. Louis, https://fred.stlouisfed.org/series/MORTGAGE30US. Accessed 15 July 2026.
- “Area Median Income and Property Eligibility Tool.” Freddie Mac Single-Family, Freddie Mac, https://sf.freddiemac.com/working-with-us/affordable-lending/area-median-income-and-property-eligibility-tool. Accessed 15 July 2026.
- “Average Levy Rates by County Interactive Data Graphic.” Washington State Department of Revenue, https://dor.wa.gov/about/statistics-reports/average-levy-rates-county-interactive-data-graphic. Accessed 15 July 2026.
- DeSmith, Christy. “Is Small Thinking the New American Way?” Harvard Gazette, 16 Jan. 2025, https://news.harvard.edu/gazette/story/2025/01/is-small-thinking-the-new-american-way/. Accessed 15 July 2026.
- Hamilton, Emily. “Reforming US Building Codes.” Regulation, vol. 47, no. 4, Winter 2024–2025, Cato Institute, https://www.cato.org/regulation/winter-2024-2025/reforming-us-building-codes. Accessed 15 July 2026.
- Helean, Riley. “How Land Limits Contribute to Washington’s Housing Crisis.” Washington Center for Housing Studies, 17 July 2025, https://housingstudies.biaw.com/reports/how-land-limits-contribute-to-washingtons-housing-crisis. Accessed 15 July 2026.
- Kuo, Fan-Yu. “Inflation Cooled in June as Gas Prices Eased.” Eye on Housing, National Association of Home Builders, 14 July 2026, https://eyeonhousing.org/2026/07/inflation-cooled-in-june-as-gas-prices-eased/. Accessed 15 July 2026.
- Potter, Brian. Labor Productivity in Construction. Aspen Institute, Sept. 2025, https://www.aspeninstitute.org/wp-content/uploads/2025/09/Potter_Construction_Productivity.pdf. Accessed 15 July 2026.
- Sequeira, Robbie. “States Are Changing Fire Codes to Make Housing Cheaper. Some Safety Experts Are Worried.” Tri-Cities Area Journal of Business, 23 June 2026, https://www.tricitiesbusinessnews.com/articles/states-are-changing-fire-codes-to-make-housing-cheaper-some-safety-experts-are-worried. Accessed 15 July 2026.
- Smith, Nathan. “A Henry Ford for Housing.” Law & Liberty, 24 Nov. 2025, https://lawliberty.org/a-henry-ford-for-housing/. Accessed 15 July 2026.
- Smiley, Andrea M. The Cost of Regulations 2025. Washington Center for Housing Studies, 2025, https://housingstudies.biaw.com/reports/the-cost-of-regulations-2025. Accessed 15 July 2026.
- U.S. Census Bureau. “Income in the Past 12 Months (in 2024 Inflation-Adjusted Dollars).” American Community Survey 1-Year Estimates Subject Tables, Table S1901, https://data.census.gov/table/ACSST1Y2024.S1901?q=household+income&g=040XX00US53. Accessed 15 July 2026.
- U.S. Census Bureau. “Income in the Past 12 Months (in 2024 Inflation-Adjusted Dollars).” American Community Survey 5-Year Estimates Subject Tables, Table S1901, https://data.census.gov/table/ACSST5Y2024.S1901?q=household+income&g=040XX00US53$0500000. Accessed 15 July 2026.
- Washington State Department of Commerce. Housing Needs Assessment Guidance. Washington State Department of Commerce, https://deptofcommerce.app.box.com/s/cwnxwnxwdjyhzdrxu6jsxpuwb000x252. Accessed 15 July 2026.
- Washington State Legislature. “HB 1164: Expanding Urban Growth Area Boundaries for Residential Development.” Bill Summary, Washington State Legislature, https://app.leg.wa.gov/billsummary?BillNumber=1164&Initiative=false&Year=2025. Accessed 15 July 2026.
- Washington State Legislature. “HB 2141: Concerning Building Codes.” Bill Summary, Washington State Legislature, https://app.leg.wa.gov/billsummary?BillNumber=2141&Year=2025&Initiative=false. Accessed 15 July 2026.
- Washington State Legislature. “SB 5613: Concerning the Development of Clear and Objective Standards, Conditions, and Procedures for Residential Development.” Bill Summary, Washington State Legislature, https://app.leg.wa.gov/billsummary?BillNumber=5613&Year=2025. Accessed 15 July 2026.
- “State Portal.” Building Energy Codes Program, U.S. Department of Energy, https://www.energycodes.gov/state-portal. Accessed 15 July 2026.
- “Washington Home Values.” Zillow Home Value Index, Zillow, https://www.zillow.com/home-values/59/wa/. Accessed 15 July 2026.
- Wagener, Allaire Conte. “Wages Are Catching Up With Home Price Growth. So Why Don’t More Buyers Feel Empowered?” Realtor.com, https://www.realtor.com/advice/finance/wages-needed-for-affording-home/. Accessed 15 July 2026
Disclaimer
The content in this report is intended for informational purposes only. The information contained in this report may not constitute the most up-to-date economic, housing, or other information, nor does it represent a complete assessment of the housing market. This report does not constitute any recommendation or solicitation to any person to enter into any transaction or to adopt any investment strategy. Any business or investment decisions should not be based purely on the information presented in this report. Readers are encouraged to seek independent professional investment, legal, and/or tax advice. All liability with respect to actions taken or not taken based on the contents of this report are hereby expressly disclaimed. The content is provided "as is;" no representations are made that the content is error-free.